Visually Organize Data From Databases And Spreadsheets With Tableau
Tableau provides a set of tools for database analysis by allowing users to analyze large chunks of data in an easy way. It has three versions including Tableau Desktop, Tableau Server and Tableau Public. With the help of any of these tools, you can easily process files from databases, spreadsheets and data warehouses for easy analysis. Furthermore, the analyzed data can even be published online. Tableau applications can not only be used for data visualization but can also be helpful for presenting data to an audience just like a PowerPoint presentation.
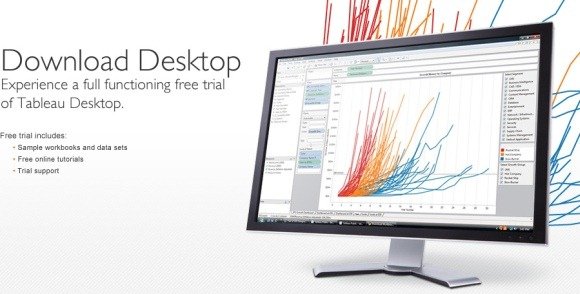
Tableau Desktop is based on technology developed from Stanford University, which can be used to arrange and analyze huge chunks of data by functions as simple as drag and drop. With the help of this tool you can connect to data from a database for visual representations and interactive dashboards, which are as easy to use as Microsoft Excel. Similarly, Tableau Server is a tool for business intelligence which provides the utility to replace cumbersome applications for quicker results. Moreover, if you are looking to publish your data online to share it with clients, company employees or customers, then Tableau Public is the right tool for you. For the purpose of his post, we will explore some features of Tableau Desktop.

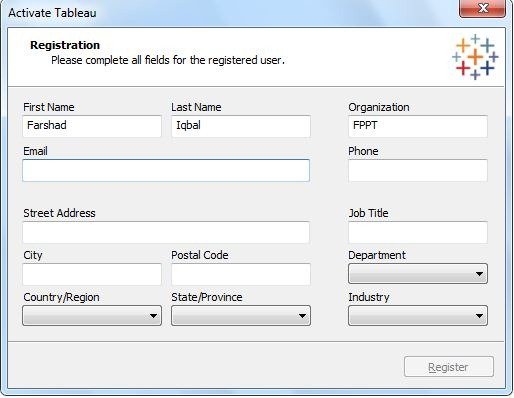
At first launch, you will have to sign up to begin using Tableau Desktop. After registration you can begin importing data from a wide variety of formats using File -> Open. Some of the supported formats include some native Tableau formats such as TWB and TWBX, whereas you can also import data from formats such as XLS, XLSX, CSV (MS Excel database), MDB, ACCDB (MS Access Database), TXT and others.
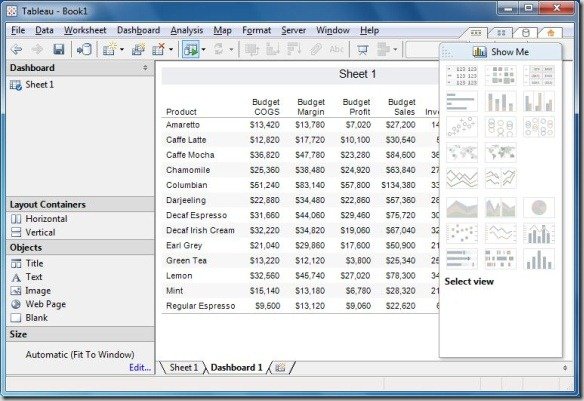
The available information is displayed in an easy to use Dashboard from where you can analyze data by using the various options available within the dashboard. For example, clicking on options like Budget Margin, Inventory and Profit will create and populate the respective fields within the Dashboard. The Data drop down menu provides options to connect to a data source, whereas you can create and copy worksheets from the Worksheet tab.
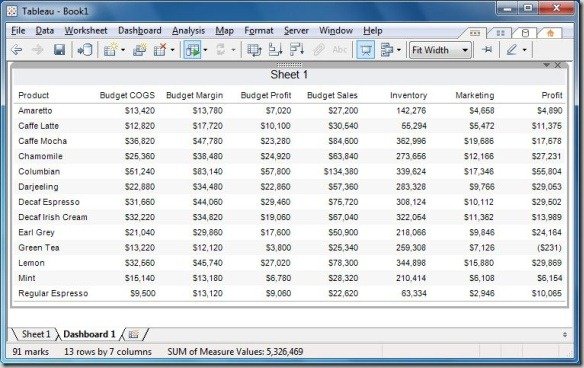
If you require more than one Dashboard for more elaborate data analysis, then go to the Dashboard drop down menu and select New. This will create another Dashboard within a new tab. The Map, Format and Server drop down menus can be used to format your data, connect to a server and to publish your data online. You can also present data like a PowerPoint presentation by going to Windows -> Presentation Mode.
The Tableau Desktop Personal Edition costs $999 and the Tableau Desktop Professional Edition costs $1,999. To buy Tableau Server you will have to contact the developer.
Go to Download Tableau Desktop
