Visualize Data Across Geographic Location in Excel
Visualizing data concerning locations and geography can be difficult. Usually, it takes an expert to create this. There are technical aspects to consider involving graphic design and knowledge of the locations. The data and how it is represented must also be accurate. Still, visualizing this information must be done in order to create a more vivid picture of what’s happening and make your audience better understand your data. Having such visualizations can enrich your reports and presentations, and even give you a better grasp of trends and demographics involving your data. Here is how you can visualize data across geographic location in Excel.

Create Beautiful Geographic Heat Maps
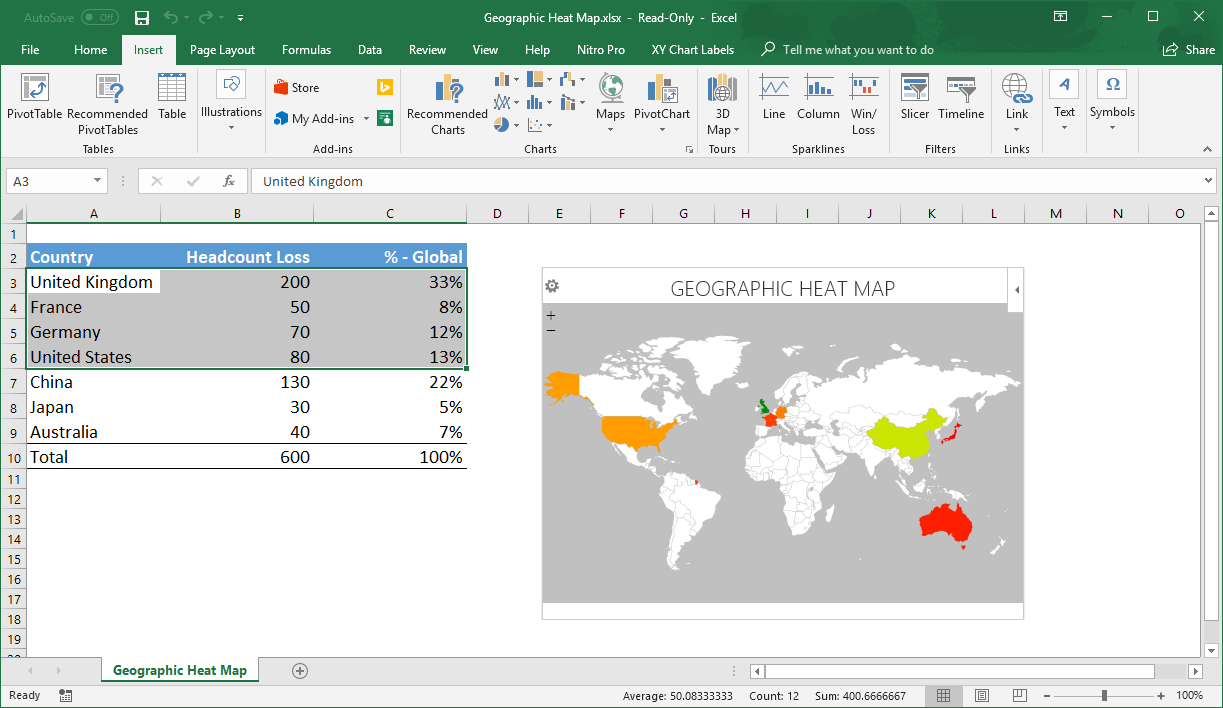
Instead of spending hours with a professional or trying to go at it yourself, you can actually create a geographic heat map to visualize your data across a country, continent or any other location. This is with the help of the Geographic Heat Map add-in for Excel.
The Geographic Heat Map add-in is a great tool that adds more to Excel’s functionality. You extend Excel’s features so you can do more with the program without even leaving it. This means everything that you need to do is in one place–in Excel–so you don’t get distracted and can focus more on your job.

Visualize Geographic Data with this Add-in
To install this cool add-in, just go to the Microsoft AppSource portal. Be sure to log in with your Office credentials and search for Geographic Heat Map. Once you have the app, click on the “Get It Now” button and continue installing in Excel.
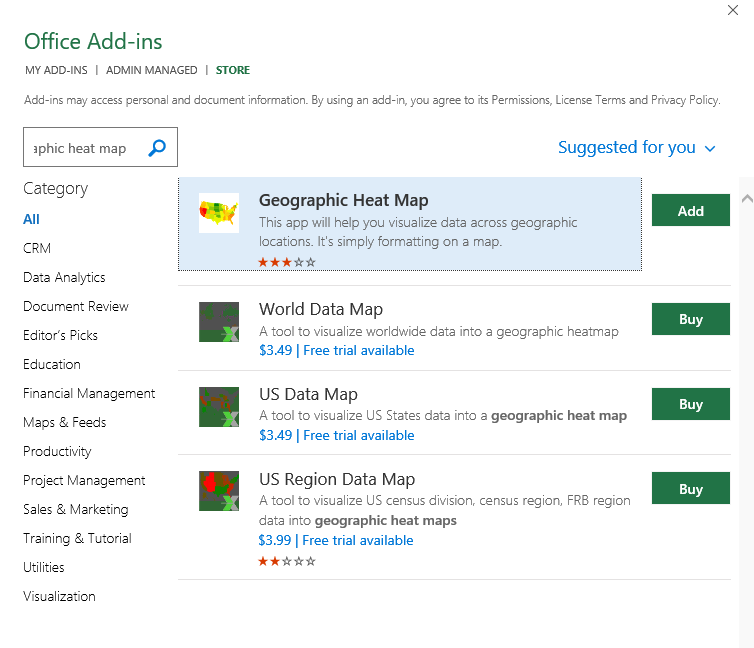
Another way to install this add-in is through Excel. In Excel, you can just go to Insert -> Store and then find the add-in through the Categories or just by typing in the appropriate keyword in the Search Box. Once you see the add-in, just click “Add” and the add-in will be installed after a few seconds.

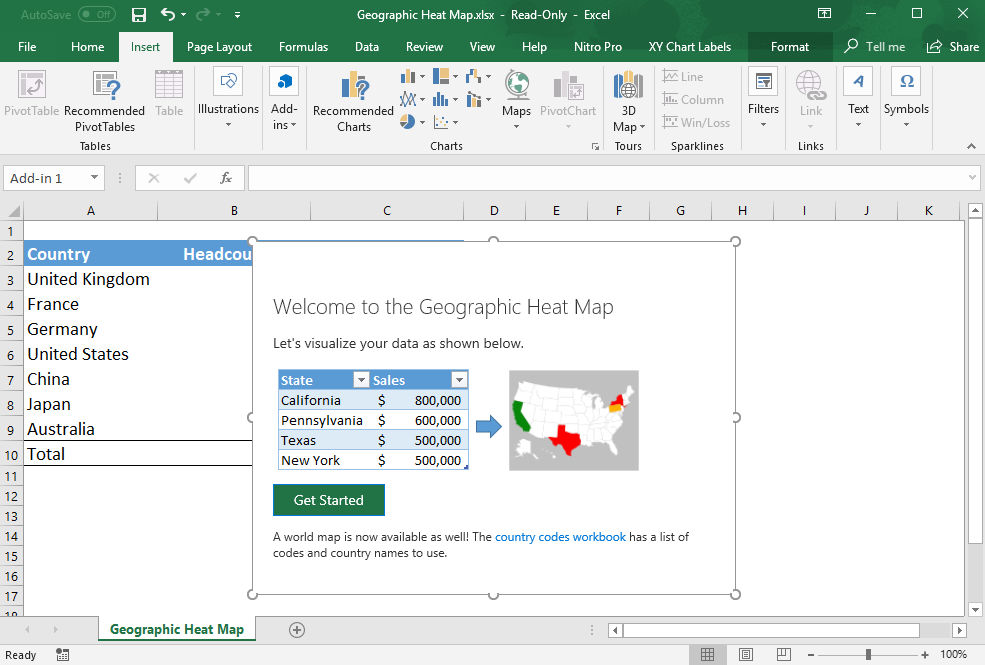
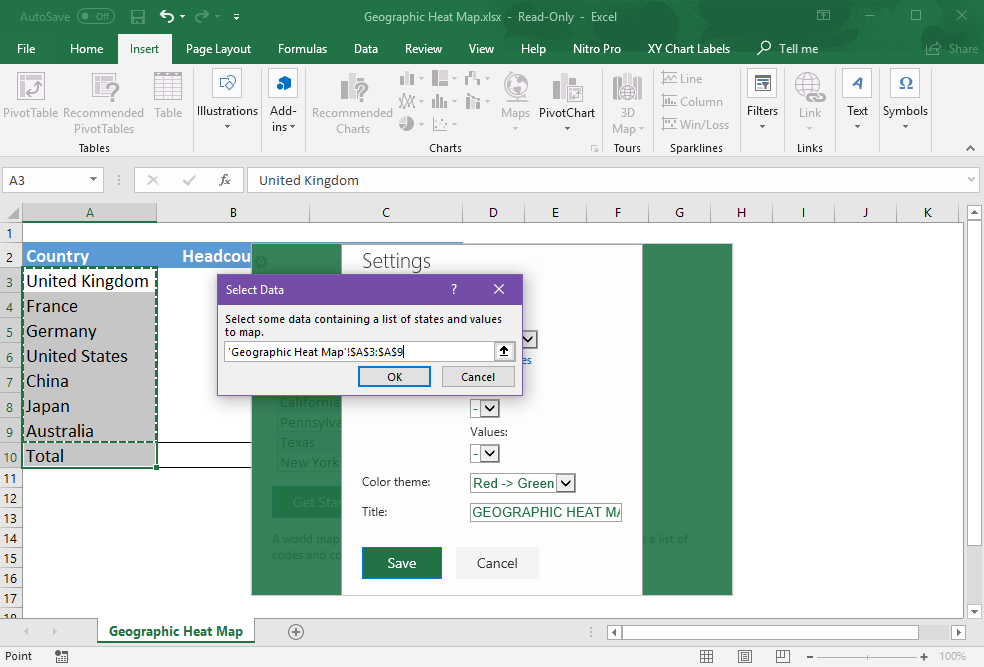
Now, you will see the Geographic Heat Map add-in in the Insert tab in the Ribbon. The add-in panel will also be in the worksheet and it will urge you to get started. You can first choose your map, which encompasses the countries or the locations of your data. Then, choose the data range and customize it however you like in terms of column, color theme, and title.

Once you click on Save, you will see your map with the Geographic Heat imagery reflecting your data. You can use this for all your worksheets and data sets that contain countries and other locations.
What’s also great about this add-in is that you can download it once using your Microsoft credentials and whenever you open a device and use Excel, as long as your own credentials are logged in, your add-ins will be there. This means you don’t have to download the add-in all the time.
