Using PowerPoint to create logic models
In PowerPoint you can create logic models by using logic connectors and functions, digital electronics represent signals by discrete bands of analog levels, rather than by a continuous range.
Creating logical design for use in evaluations is a common activity for many digital design companies, engineering Universities and electronics enthusiasts, also digital design applications for logic synthesis lay primarily in digital computer design or programmalbe logic controllers.
However one of the biggest challenges in creating logic model or digital designs is technological and find a good software that let us design logic models. Beside the are some professional applications like Visio that you can use to create nice digital diagrams that are originally designed to achieve this complex task, some people may prefer to use the popular PowerPoint from Microsoft Office suite of programs that is widely adopted and let you share the .ppt files with your coworkers or online.
Even if Microsoft Powerpoint is used mainly for presentations you can create logic models using PowerPoint and shapes. Many features like autoshapes or shapes in Microsoft PowerPoint 2010 enables you to create and design logic models and other visual diagrams. Here we will see how to create logic models using shapes and other diagrams.
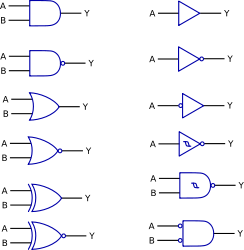
If we want to download logic connectors and elements we can get them from OpenClipart so you can then use the connectors and logical functions to highlight your boolean algebra knowledge.

This can be downloaded as SVG and PNG and can be used to create logical design diagrams in PowerPoint.
If we want to create our logic functions in PowerPoint using shapes we can use the shape grouping options. Insert a rectangle and true circle like in this picture and then click on Shape Group.

You can add some short lines on the edges and produce a logical function like this one:

Finally using PowerPoint lines and connectors you can create your logical design.
