Top 4 Critical Path Diagram Template for PowerPoint
If you need to make presentations on Critical Path Analysis then using a Critical Path Diagram Template for PowerPoint can help you to easily design the graph that describes the critical path.
In this article we will show you some of the best Critical Path Diagram designs available for download. Critical Path template is also used with other methodologies like the PERT Analysis. You can combine both techniques in project management presentations. Sometimes, creating graphs and critical path diagrams in PowerPoint is preferred over Microsoft Excel as it allows you graphically create the design and let your audience understand clearly what are the tasks involved on each step.
1. Free Download – Cluster Analysis PowerPoint Template (FREE)
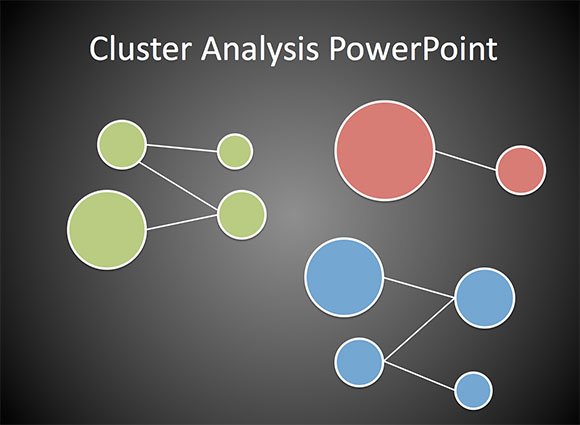
Using this PowerPoint template you can easily isolate the nodes shapes and edges to make your own custom slides with critical path graphs.
Just select the desired notes (circle shapes) and then move them along the slide.
2. Free Download – Critical Path Method for PowerPoint (FREE)
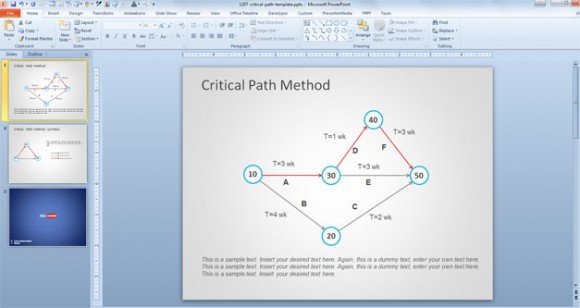
This is another free PowerPoint template design containing a graph design that you can use to represent a critical path slide in PowerPoint. Graphics are created with PowerPoint shapes so you can easily duplicate shapes and create your own graphs to make a slide for critical path analysis presentations in Microsoft PowerPoint.
3. Weighted Graph PowerPoint Template (not free)
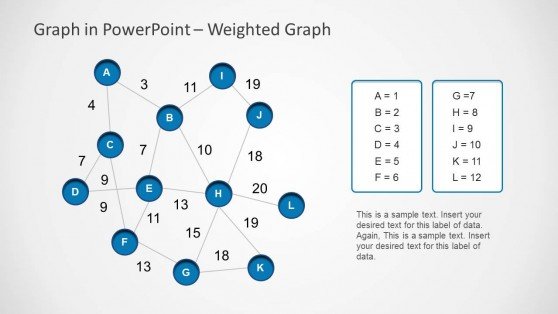
The weighted graph PowerPoint template published at SlideModel.com allows you to create weighted graphs easily in PowerPoint by manipulating shapes. You can create your own customized graphs and change the text placeholders to make the slide fit your presentation needs.
Aside of this weighted graph design for presentations you can download thousands of professional-designed PowerPoint templates from SlideModel – Remember to use the coupon code FPPT to get an important discount.
4. PERT Charts for PowerPoint (not free)

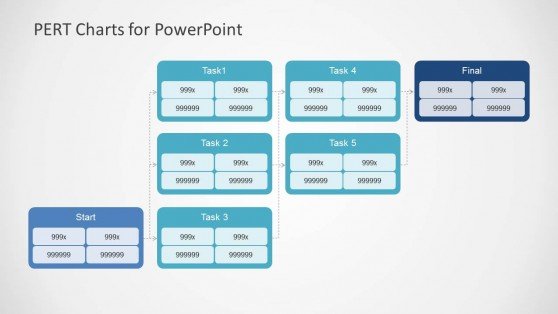
PERT Charts can also help you to prepare slides for critical path analysis. PERT stands for Program Evaluation Review Technique and it is a powerful project management tool that you can use to schedule, organize, and coordinate tasks within a project.
Sometimes, the PERT chart is preferred over the Gantt chart because it clearly illustrates the task dependencies so while creating a PowerPoint presentation you can help your audience understand exactly where the dependencies come from.
Alternatively you can download other free PowerPoint templates and slide designs that can be very useful for critical path analysis or the top Gantt Chart PowerPoint templates.


