Visualization

Infographics: Search, Upload And Share Visualizations At Visualizing.Org

Infographics and data visualizations are an interesting way of displaying complex data in an easy to understand manner. Visualizing.org is a platform where people can find, share and upload data visualizations and infographics. This website is not only helpful for people who wish to showcase their visualizations but can also be helpful for organizations and …

3D Color Histogram

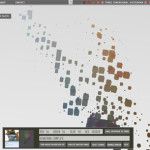
This is an example of a visualization tool that you can use to get some inspiration to make 3D histograms in PowerPoint presentations. In this case, the 3D Color Histogram will use your web cam to analyze the color information and in real time make a 3D Histogram in the browser page. Learn more in http://shinydemos.com/3d-color-histogram/ …

Marimekko Charts PowerPoint

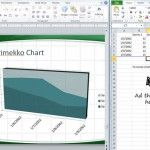
Marimekko Charts are widely used in finance projects, economy and also in MBA courses like in Harvard Business School. Marimekko charts are also widely adopted in Marketing for example to analyze customer segmentation and market segmentation. Here we will show you how to build a Marimekko Chart in PowerPoint. Once you have chosen the chart type, you need …