Best Kanban Software of 2025

Kanban is a scheduling mechanism for controlling and formulating an effective production system. It is tied to the just-in-time delivery system for maintaining an effective stock of goods for sale.

Kanban is a scheduling mechanism for controlling and formulating an effective production system. It is tied to the just-in-time delivery system for maintaining an effective stock of goods for sale.
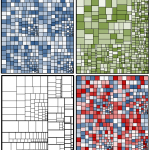
A treemap is a powerful visualization tool that helps present hierarchical data through nested rectangles. Each rectangle represents a category or subcategory within the hierarchy, and its size is proportional to a specific numerical value, such as sales figures or file sizes. Treemaps are especially effective for comparing the sizes of different categories, and they …

Methodologies can often be complex and much of the core concept can often get lost in translation. Data visualization aims to bridge this gap by adding substance to the methodology. And arguably, none explains it better than Edward Tufte! Who is Edward Tufte? Edward Tufte, sometimes known as ET, is known for his simplified data …
Complex data, trends and analysis can be quite difficult to explain to an audience in raw form. Many presenters and analysts try to represent such information using tables and charts, however, looking at data in statistical form with a few legends and headings isn’t all that easy to soak in for an audience. This is …

Sometimes things are so bad that what you see on top is just the tip of the iceberg. Tip of The Iceberg PowerPoint Template is a free presentation template that can be perfectly used to depict this dilemma.
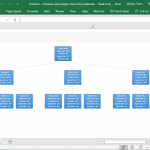
Microsoft Office programs such as Word, PowerPoint and Excel have been around for so long. They’re widely recognized and used in many business and academic activities, and considered as reliable companions in creating documents, managing data, or presenting an idea. While these programs are great in themselves, add-ins are there to make things a little …
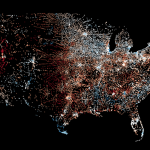
Data visualization can make everything look better and more understandable. From simple stats to comprehensive analysis, visualization tools such as charts and graphs can greatly help you gain better insight into your business, projects, surveys, and reports. With this in mind, Microsoft has developed SandDance, a free data visualization app that helps you create stunning …

In the world of data visualization, sparklines hold a unique place. These tiny graphics, roughly the size of a line of text, pack an enormous amount of data into a small space, providing a clear, concise picture of trends, patterns, and variations. From Edward Tufte’s invention to their application in Microsoft PowerPoint and other platforms, …
It’s no rocket science and in fact it’s really nothing new—we understand and remember information better when we can visualize it. In school, class discussions are more dynamic and effective with the help of visual aids instead of hours of lectures and recitations. In the corporate setting, visualizations are the lifeblood of organizations and businesses. From …

In recent years there has been an influx of some interesting image editing apps which allow retouching images without the complexity of PhotoShop. While many apps like Prisma or Photo Lab come with basic filters, there are better options for comprehensively retouching your images without the need for extensive knowledge about image editing. Fotor image …
We will send you our curated collections to your email weekly. No spam, promise!