Tables

Turn Your Data into Explorable Networks in Excel
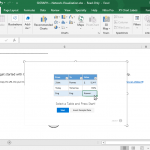
Create-a-New-Table-Or-Select-One-For-Gigraph

Working with Excel spreadsheets and analyzing data as well as catching trends can be tedious and time-consuming. However, it must be done. Analyzing data is important, especially at this time when we deal with large amounts of information on a daily basis. To help you make better sense out of your data, you can use …

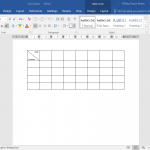
How to Insert HTML Table in PowerPoint

Inserting HTML tables in PowerPoint 2010 and 2013 may sound tricky at a glance but it isn’t. Here we will show you how to insert HTML tables in Microsoft PowerPoint easily by using copy and pate. There may exist lot of different reasons why you’d like to insert an HTML into PowerPoint presentations, for example …

How to Make a Cohort Analysis Chart in PowerPoint

Cohort Analysis it’s a time-tested segmentation technique used to understand user behavior and recently adopted by authors of Customer Development and Lean Startup methodologies. In Running Lean and Lean Analytics books there are mentions to cohort analysis since this segmentation technique can help entrepreneurs to understand the behavior of early adopters of your product or startup …