PowerPoint Presentations

How to Create a Venn Diagram in PowerPoint

Venn Diagrams are often used to create intuitive graphics in which you want to make correlations between different groups. Microsoft Powerpoint can help you creating Venn Diagrams with the SmartArt tool.  There are different ways to generate Venn diagrams in PowerPoint. In summary: To create a Venn diagram in PowerPoint using SmartArt graphics, go to …

Pictograms For PowerPoint

A pictogram is a figure that represents something using an image or illustration. It is also known as pictogramme and means pictorial representation of a physical object. Pictographs are often used in writing and graphic systems in which the characters are to considerable extent pictorial in appearance. Also in presentations you can use pictograms to …

PowerPoint Charts At A Glance

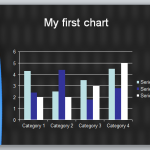
PowerPoint Charts can be created with any Microsoft PowerPoint release. However, the latest versions of Microsoft PowerPoint comes with enhanced charts and options that helps us create engaging PowerPoint charts for our presentations. When you create a new slide with PowerPoint, the center text box will display small icons that allows you to access different …