Australia Map Template for PowerPoint Presentations

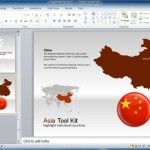
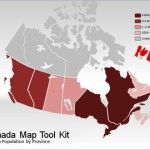
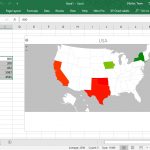
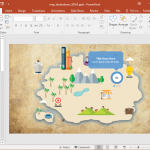
Australia Map Toolkit is an Animated PowerPoint Template by PresenterMedia which provides various sample slides containing fully editable maps of Australian States and the country on the whole. This map template for PowerPoint is similar in nature to the other map templates covered earlier, including the Animated World Map Toolkit, Asia Map Template, Europe Map …

