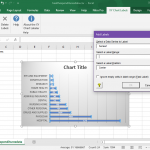
Add Labels to XY Chart Data Points in Excel with XY Chart Labeler

When you’re creating charts and graphs in Excel, the process is pretty much straightforward. You use the built-in Wizard within Excel to create compelling visuals that analyze and represent your data. Usually, when you create charts, you can format your chart labels with Series Name, Category Name, and Value. You can label them however you …


