Charts

How to Easily Create Bubble Charts in Excel to Visualize Your Data

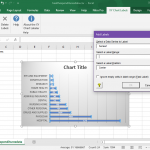
Vibrant Bubble Chart For Excel

Data visualization is important in managing, analyzing, organizing, and displaying all kinds of information. It is through data visualization that you can make more sense of the data that you have, which you may be incapable if you only have tables and worksheets in front of you. In Excel, there are many visualization tools such …

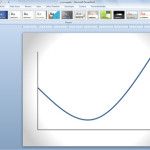
Sparklines in PowerPoint Presentations

In the world of data visualization, sparklines hold a unique place. These tiny graphics, roughly the size of a line of text, pack an enormous amount of data into a small space, providing a clear, concise picture of trends, patterns, and variations. From Edward Tufte’s invention to their application in Microsoft PowerPoint and other platforms, …

How To Make Better Business Decisions Using Excel 2016 Charts

Decision-making is one of the trickiest parts of running a business. One wrong move and you can send your company down the drain or risk your brand’s image. When it comes to running a company or a business, you are not only thinking and deciding for yourself. You’re also deciding for your whole organization. You hold …