Charts and Diagrams for PowerPoint

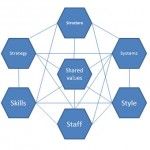
The Seven S Model in PowerPoint

McKinsey 7S model is a business diagram that involves seven interdependent factors which are categorized as either “hard” or “soft” elements. The seven elements in a 7S model includes: Strategy, Structure, Systems, Shared Values, Skills, Style, Staff. Hard elements are easier to define or identify and management can directly influence them. These are strategy statements; organization charts and reporting lines; and formal processes …

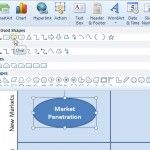
How to Make an Ansoff Matrix in PowerPoint

Ansoff Product-Market Matrix is a matrix widely used as a business tool that helps businesses decide their product and market growth strategy. Ansoff’s product/market growth matrix suggests that a business’ attempts to grow depend on whether it markets new or existing products in new or existing markets. In PowerPoint we can design an Ansoff Matrix using …

Make Sankey Diagrams in PowerPoint

Sankey diagrams are a specific type of flow diagram that are widely used in thermodynamics and material flow management. In this kind of diagrams, the width of the arrows is shown proportionally to the flow quantity. You can use this kind of Sankey Diagrams as a visualization of energy, material or cost transfers between processes. …