Chart

Best Digital Eye Chart Generators For Testing Visual Acuity

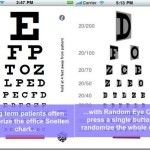
Eye charts are used to determine visual acuity and contain numerous rows of standard symbols in different sizes, known as optotypes. While eye charts have been used by eye specialists (ophthalmologists) since decades to determine vision related problems of patients, in recent years computer-based alternatives for eye charts have also become available. In fact, some …

Make a Chart in PowerPoint and Excel

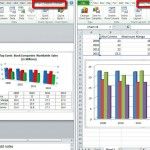
We’ve explored creating several kinds of charts in PowerPoint in previous tutorials. We’ve also created a chart and edited it accordingly. Now, we will create a chart in Excel and later explain the advantages of using Excel and PowerPoint, their strengths and weaknesses in areas. Creating a chart in Excel is a very straightforward task. You don’t …

How to Make a Quad Chart in PowerPoint

Quad charts are a highly effective tool for presenting complex information in a visually appealing and easily digestible format. These charts divide data into four distinct quadrants, allowing you to convey multiple ideas or datasets in a single slide. Used across various industries, from business and marketing to research and education, quad charts can help …

Save Chart Templates in PowerPoint 2013

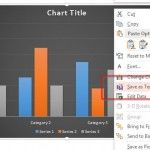
PowerPoint Chart Templates can be very useful within your organization. This feature is available in PowerPoint 2010 as we could see in How to Use Chart Templates in PowerPoint, however if you are moving to PowerPoint 2013, you will notice that Save As Template option is not available in the same Design tab that it …