Business

Visualize Data Across Geographic Location in Excel

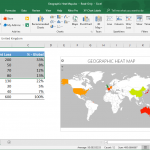
Complete Geographic Heat Map

Visualizing data concerning locations and geography can be difficult.  Usually, it takes an expert to create this. There are technical aspects to consider involving graphic design and knowledge of the locations. The data and how it is represented must also be accurate. Still, visualizing this information must be done in order to create a more …

How to Make a Geographic Heat Map in Excel

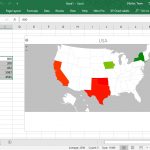
Create Your Own Heat Map

Visualizing data can help you better understand what could be a difficult set of information if you’re just looking at purely numbers. This is why charts, graphs, infographics and geographical heat maps are very useful, not just in reports and presentations, but also in helping you make sense of data. Such visualizations can also help …

Bring Your Videos & Slides to Life with VCASMO

VCASMO Web Service

If you think that mixing videos and slideshows together the way pros do takes a lot of time and technical knowledge, think again. The impressive videos you may see on YouTube aren’t actually that hard to emulate–thanks to VCASMO.

Prevedere Forecasting Tools for Predictive Analytics in Excel

prevedere-excel-taskpane

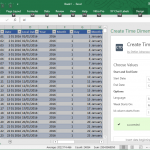
Prevedere is recognized as one of the best business intelligence software out there. Now, you can have the power of the best intelligence platform right within Microsoft office. This is because Prevedere is now available as an add-in for Microsoft Excel. Prevedere is one of the world’s best and most revolutionary software when it comes …