Small Business Expense Sheet For Excel
Small business, just like any other business, needs to be updated about the company’s financial status or standing. From the income to the expenses, proper planning, budgeting, and monitoring is important to ensure that the company is financially healthy and can operate smoothly while generating enough profits to cover expenses.

Keep Track of Expense Trends
Speaking of expenses, it is important to know just how much the company spends on various things. There may also be times when expenses are relatively high, and these should be considered during planning and budgeting. To help you keep track of your expense trends, you can use this Small Business Expense Sheet for Excel.
Expense Analysis Template
Companies do have many different types of expenses. And they not only make budget planning for revenues and incomes but also plan expected expenses for the future. This Expense Analysis Dashboard lets you record monthly target and actual expenses and make comparisons to see the target realization percentages in Excel. Basically the template consists of 3 main sections: Dashboard, Estimated Expense, Actual Expense
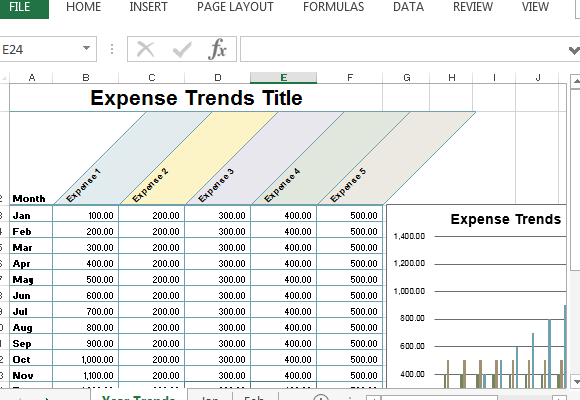
This Small Business Expense Sheet for Excel features a complex yet easy-to-navigate set of worksheets that work together to give you accurate expense trends month-to-month. This template features many worksheet tabs, starting with the Year Trends, which is the summary of all the monthly expenses. The next tabs are the monthly expense worksheet tabs, starting from January.

Automatically Update Your Expense Sheet
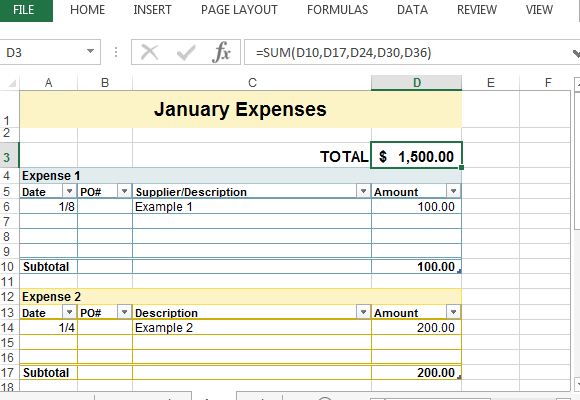
Each of the monthly expense tabs show various expense categories, represented by Expense 1, Expense 2, and so on. You can add as many categories as you need. Then, you can log your expenses to these corresponding categories. There are columns for the Date, Purchase Order Number, Supplier/Description, and Amount. The subtotal for each expense category is automatically computed on each expense table. Then, the overall total of all the expenses are also automatically calculated using built-in formula that comes with the template.
All the monthly totals are reflected in the Year Trends worksheet tab. This tab features a summary of expenses per expense category for each month, as well as the yearly total for each category. This shows you how much you spent on each of the expense categories.
There is also a Trends sparkline under each expense category to easily give you a visual of what the trends are for each expense category.

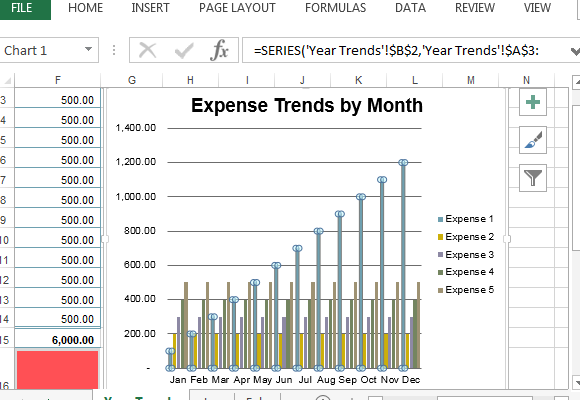
There is a corresponding line chart that reflects the monthly expenses, also giving you an idea of the big picture of your expenses. This graph can also be used for your reports and presentations.
