Segmented Pyramid in PowerPoint using SmartArt
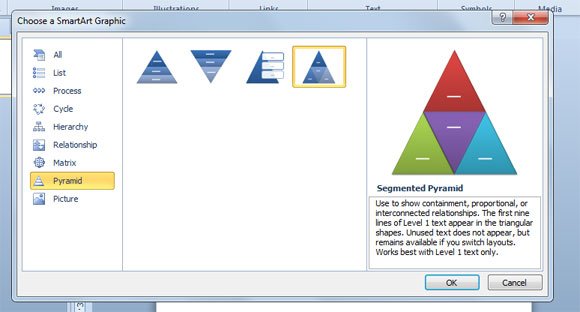
Using SmartArt we can create some nice PowerPoint graphics, and the Segmented Pyramid is one of the available graphics that allows us to make a great pyramid chart in PowerPoint.

You can use this pyramid to show containment, proportional, or interconnected relationships. The first nine lines of Level 1 text appear in the triangular shapes. Unused text does not appear, but remains available if you switch layouts. Works best with Level 1 text only.
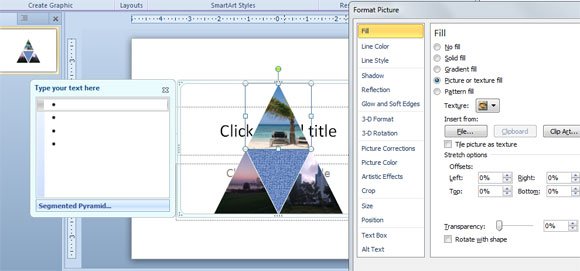
By filling the pyramid segments with images you can create nice triangle cycles in PowerPoint easily. Lets see this example below:

This shows the segmented pyramid graphic or segmented triangle with images instead of colors or text. Of course you can also use any other fill option (available in Format Picture) which can be really convenient if you want to use a gradient effect, a texture as pyramid background or even a solid color.
In some situations, using pictures and images instead of colors can help to understand an idea or concept and this can be a powerful data visualization technique.
