Sample PivotTable Report For Excel
PivotTables are interactive tables that can help you with worksheets containing huge amounts of data. You can use a PivotTable to organize, summarize, sort and extract data. Reports and analysis make use of PivotTables in order to determine relationships, spot trends or patterns, and make comparisons.

Generate Pivot Tables from Sample Report
If you are new to Excel and you want to create a PivotTable Report, you can use this Sample PivotTable Report for Excel. This sample report will allow you to create a manageable table for large amounts of data. This sample report can help you create tables for business, school or academics, or personal reports. You can also learn how to use Excel PivotTables in an article here.
This sample PivotTable report can help you get started on learning how PivotTables work and create PivotTables for yourself. The sample contains customer and sales data. You can replace this with your own information. You can change the column headers for your own categories, as well as add or delete new columns or rows for your own data.

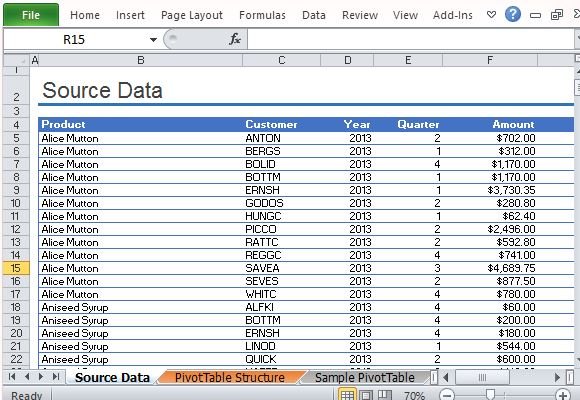
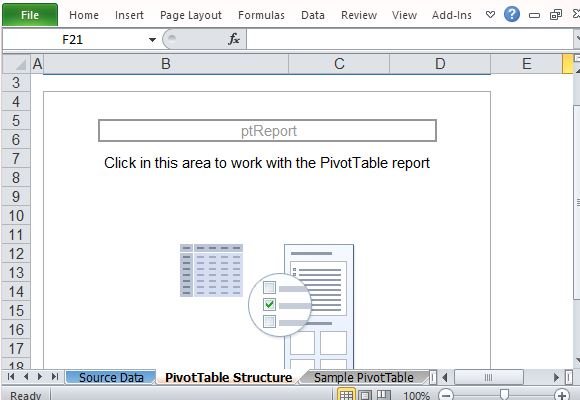
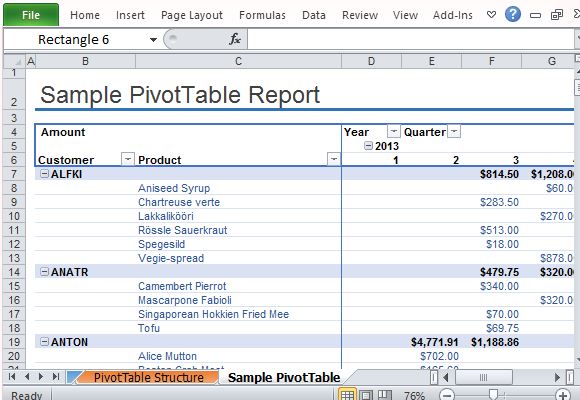
This sample PivotTable report contains a worksheet for your Source Data, which contains all types of information that you would have to sort through and analyze. As you can see in the worksheet, it’s hard to find trends, comparisons or similarities just by looking at the whole table. The next worksheet, which is the PivotTable Structure, is already built in the sample report for you while the Sample PivotTable shows you the PivotTable itself. Here, you can sort through hundreds of data for viewing and filtering to create all types of analysis and reports.

This Sample PivotTable Report is simply hundreds of columns of data. However, you can also store millions of data sets and use a PivotTable for extracting that data and separate the significant from the large pool of information.
