PowerPoint Project Management Timeline Gantt Chart Template
Gantt charts are used for planning, tracking, and maintaining project schedules. A Gantt timeline is often color coded to mark activities, budget, time, resources, etc. PowerPoint Project Management Timeline Gantt Chart Template comes with editable Gantt chart slides that you can color code according to your requirements. Moreover, these slides come with animations to make them more visually appealing.

Animated Gantt Charts for PowerPoint
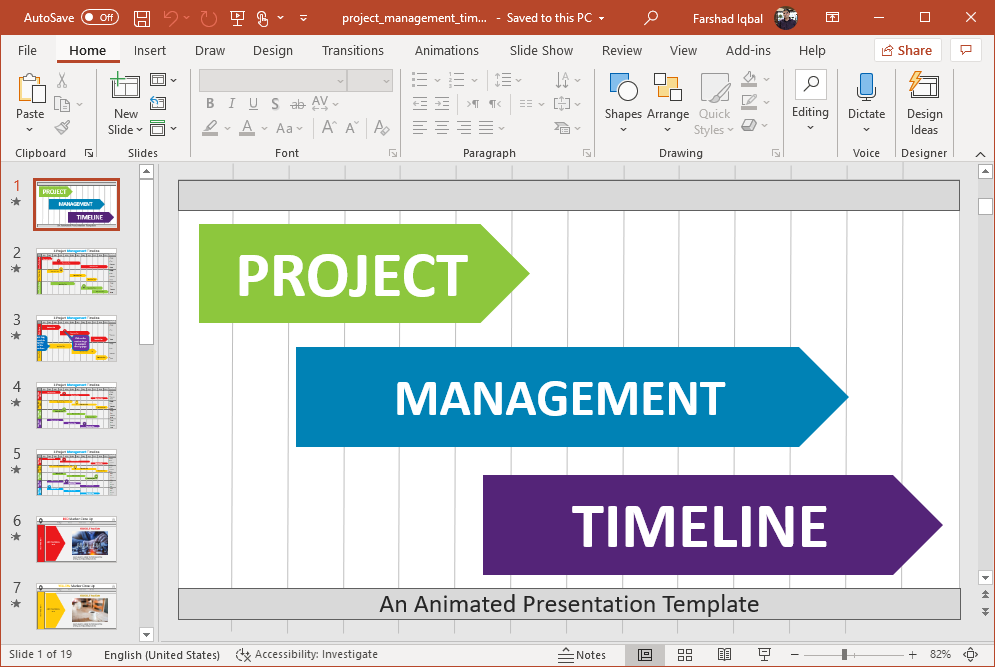
The template contains one opening slide, which is followed by four slides meant to depict your Gantt timeline. This is followed by five more slides, each with a sample, replaceable image. These five slides can be each used for explaining the relevance of each color used in the timeline.
Change Colors in the Gantt Chart
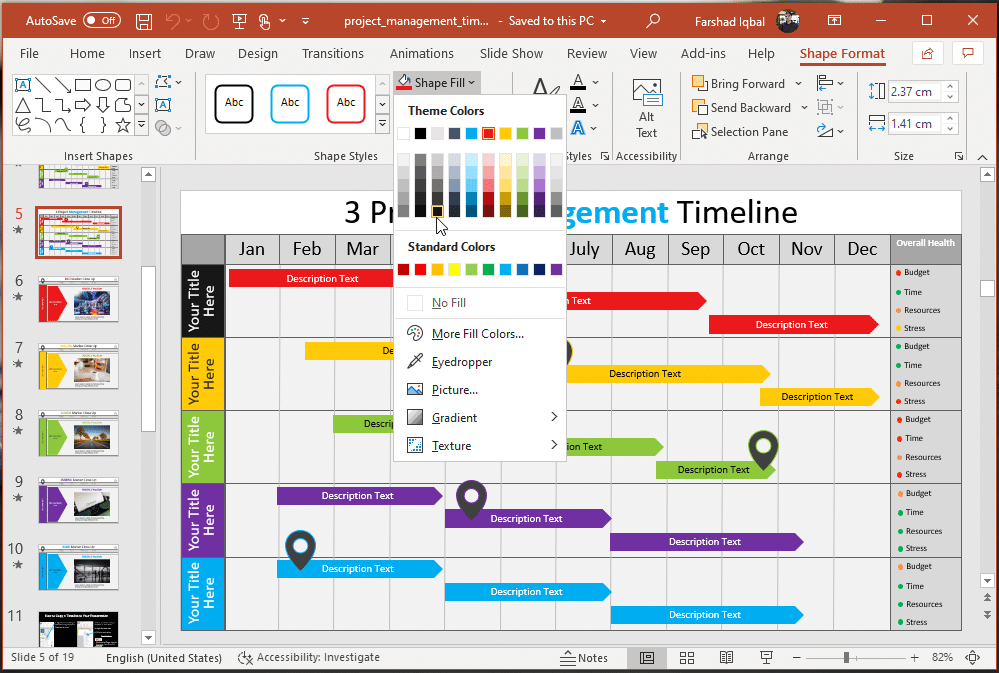
The Gantt charts provide a key on the right side of the illustrations that you can edit to explain the timeline. You can also replace and move Gantt chart elements according to need using drag and drop. The colors of the given Gantt elements can be changed via Shape Format. To change the color of any of the elements via Shape Format, use Shape Fill.
Slides to Explain Markers on the Gantt Chart
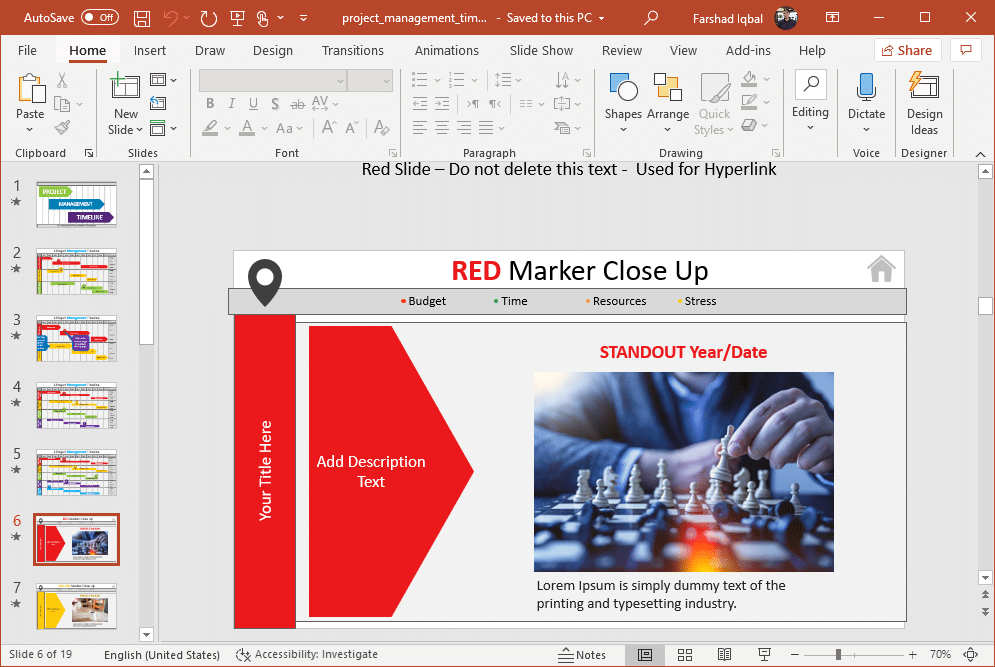
For each marker, there is one slide to explain it in detail. The default colors depicted in these five slides include red, green, blue, purple and yellow. You can also change these to a different color or color tone.
There are also sample images which can be replaced with relevant ones according to need. For example, if one of the markers represents time, you can use an image which goes with the theme. Similarly, the marker for tasks can be given a picture to symbolically represent it for visual impact.
You might also be interested in our reviews of Gantt Chart Templates and web apps.
Go to Presenter Media – PowerPoint Project Management Timeline Gantt Chart Template
Learn more here Presenter Media - PowerPoint Project Management Timeline Gantt Chart Template
Go to PresenterMedia.com

