How to Create Porter’s Value Chain Activities Diagram in PowerPoint
Last updated on December 31st, 2024
Suppose you are preparing a Marketing Plan or Business Strategy for your organization and need the popular Porter’s Value Chain Diagram in your PowerPoint slides. In that case, we will show you how to design a simple but nice enough Value Chain Diagram using Shapes. Shapes are a powerful feature in PowerPoint that enables us to create complex and straightforward diagrams for your presentations.

This tutorial will cover how to design a simple Value Chain Activities diagram in PowerPoint.

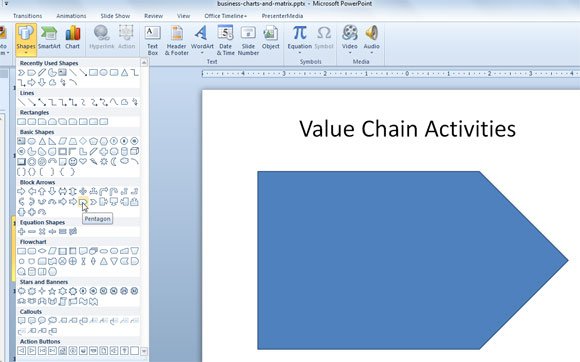
To design a Value Chain slide design for your presentation, you can start drawing a pentagon shape in your PowerPoint slide. Then change the default background to white or any other background color you want.
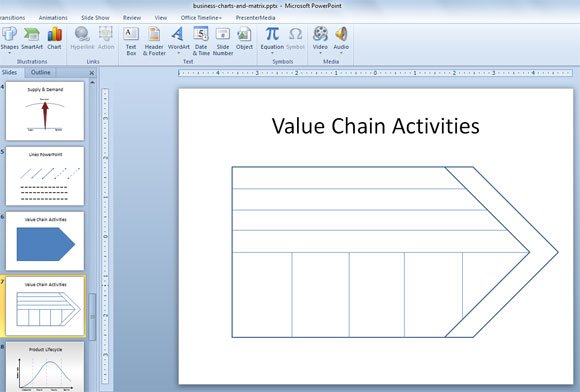
Duplicate the pentagon so we can leave an arrow on the right of the slide.
Now, you are ready to draw the vertical and horizontal slides. Make sure to use a perfect match design and then we will add text to the diagram.

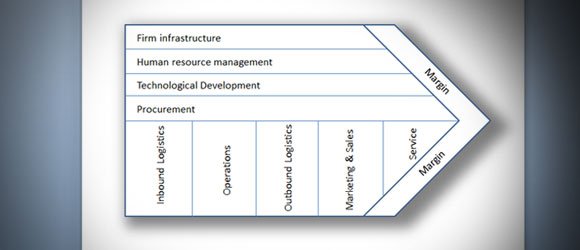
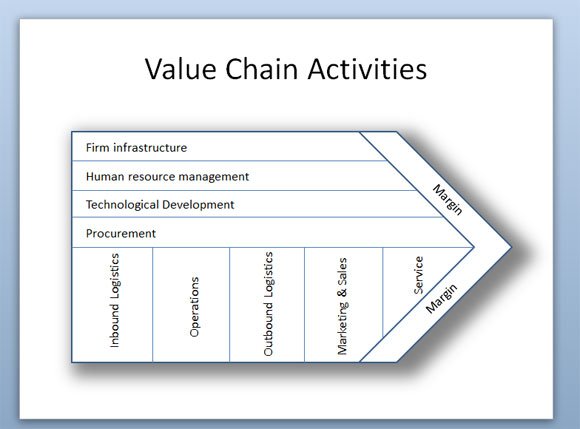
Then you can start adding textboxes for each rectangle. Notice the right arrow will display Margin, while for the internal boxes we will add the following groups.
Primary activities horizontally:
- Firm infrastructure
- Human Resources Management
- Technological Development
- Procurement
Supporting activities in vertical text.
- Inbound Logistics and Outbound Logistics
- Operations
- Marketing & Sales
- Service
This is the diagram used in Michael Porter’s Competitive Advantage book, Creating and Sustaining Superior Performance.
Finally, you can add some styles to make it impressive.

This diagram is part of the business bundle diagram for PowerPoint that you can get from FPPT.com
If you need other chain PowerPoint templates consider to download free supply chain PPT template or chains PPT template slide design. You can also download value chain templates from here.
