Porter’s Five Forces Model in PowerPoint using SmartArt
Last updated on April 23rd, 2024
If you need to create a slide to show Porter’s 5 Forces then here we will show you how to quickly create a PowerPoint graphic using SmartArt graphics.

SmartArt is a powerful tool that you can use to make awesome diagrams in PowerPoint in record time. You can create all kind of diagrams from flow charts, cycle diagrams, flow diagrams, comparison tables, radial cycle, matrix, pyramid, rings, list and process diagrams.
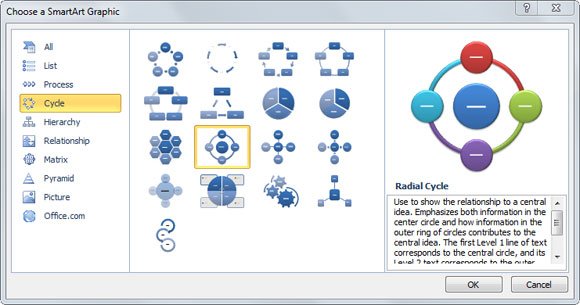
To make a Porter’s Five Forces diagram in PowerPoint using Smart Art you can start insert one of the cycle diagrams. In particular, Radial Cycle can be pretty useful.
Use to show the relationship to a central idea. Emphasizes both information in the center circle and how information in the outer ring of circles contributes to the central idea. The first Level 1 line of text corresponds to the central circle, and its Level 2 text corresponds to the outer ring of circles. Unused text does not appear, but remains available if you switch layouts.

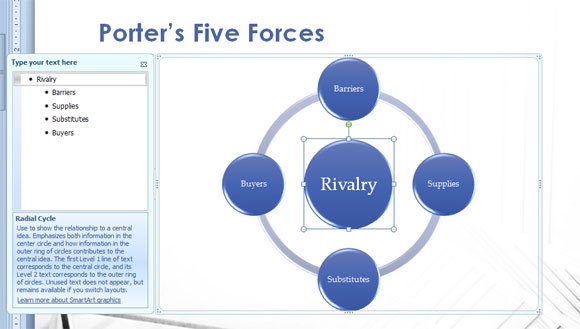
Here, insert a Radial Cycle that you can find under Cycle tab. Now enter the Porter’s 5 Forces that may include Barriers, Substitutes, Supplies and Buyers. You can enter the Competitors in the middle or Rivalry.

You can create situational strategy diagrams in PowerPoint or any other kind of diagram using SmartArt objects. For example, if you need to make a strategy map diagram, you can combine many different SmartArt objects or create a strategy timeline in PowerPoint to show the roadmap. You can also create similar diagrams for business inspired by other diagrams suggested by Michael Porter.

Very good template