How to Create a Plot Diagram & Best PowerPoint Templates
Every story has a pattern. Be it a novel, case study or a story presented in the form of a PowerPoint presentation. Many people have tried to separate the way a story unfolds in different ways, such as German novelist Gustav Freytag, who in 1863 shared his observation of how dramas have a five-part arc, which is now known as the Freytag’s pyramid and is used in plot diagrams. Here is how to create a plot diagram and best PowerPoint templates for quickly creating one.
What is a Plot Diagram?
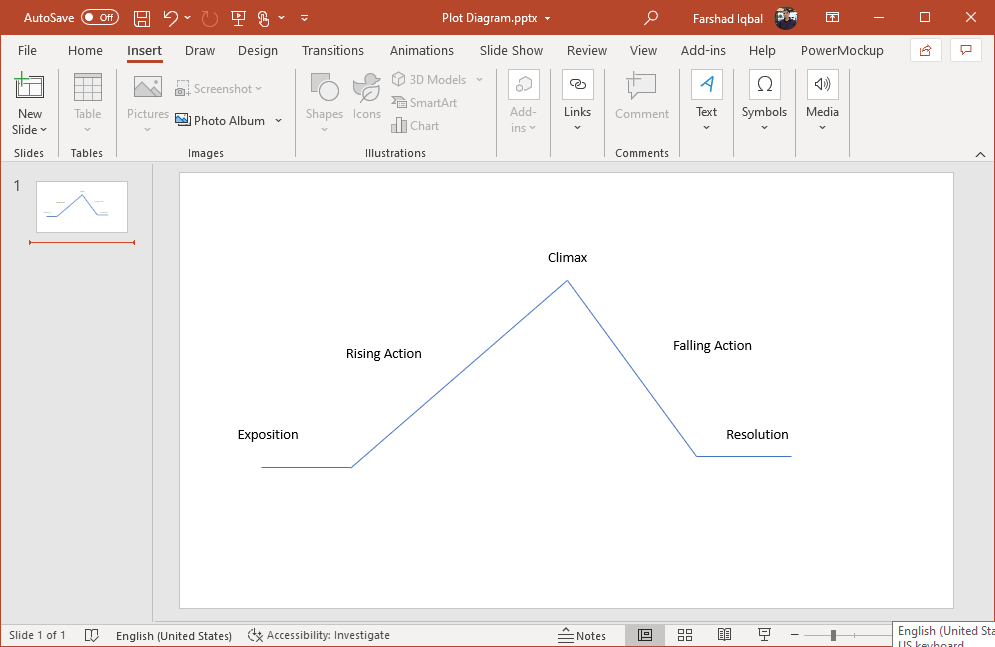
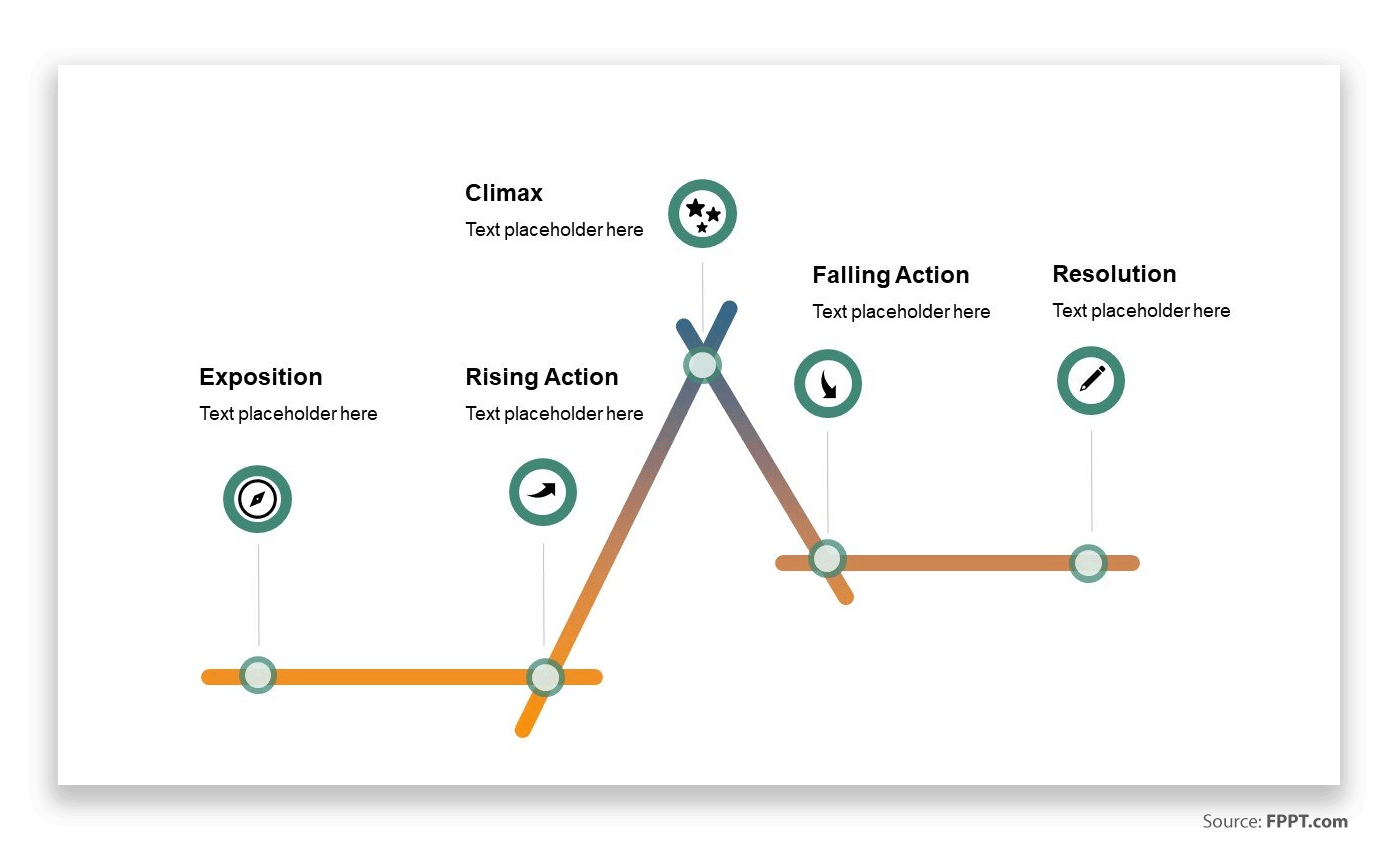
Based on Gustav Freytag’s five-part arc called Freytag’s pyramid, the plot diagram visually depicts five-parts of the story namely exposition, rising action, climax, falling action and resolution. The exposition is the introduction, followed by rising action which leads to exciting the audience, followed by the climax where the story reaches its peak and eventually leads towards falling action, which is a prelude to the conclusion.
The five part arc itself consists of various elements. A plot chart constructed based on a story is often in different formats such as a U shape or like a mountain.
Key Components of a Plot Diagram Design
When constructing a plot diagram, the following key components need to be kept in mind. These are the five key parts of the plot diagram, based on how a story unfolds.
1. Exposition: The exposition in a story according to Freytag is where important information is provided to the audience to setup the plot. This is essentially the introduction of the story. This is where the protagonist, antagonist and the setting are introduced.
2. Rising Action: To put it plainly, this is where things get really interesting, leading towards the climax of the story.
3. Climax: The climax is where the story reaches its apex point. This is filled with a lot of emotional downpour and the story reaches its peak. This is the turning point of the story.
4. Falling Action: This is when the story moves towards its conclusion, where all the pieces fall into place and the conflict goes towards a resolution.
5. Resolution: This is the outcome of the story and is also called dénouement or catastrophe. A satisfactory resolution is likely to please the audience and can be deemed essential for the success of the story.
How to Create a Simple Plot Diagram Template in PowerPoint
There are several ways you can design your plot diagram or a template to reuse later. While there are many ways a plot diagram is constructed, we will show you two methods, including one with a mountain shape and the other with a trapezoid shape.
Method 1
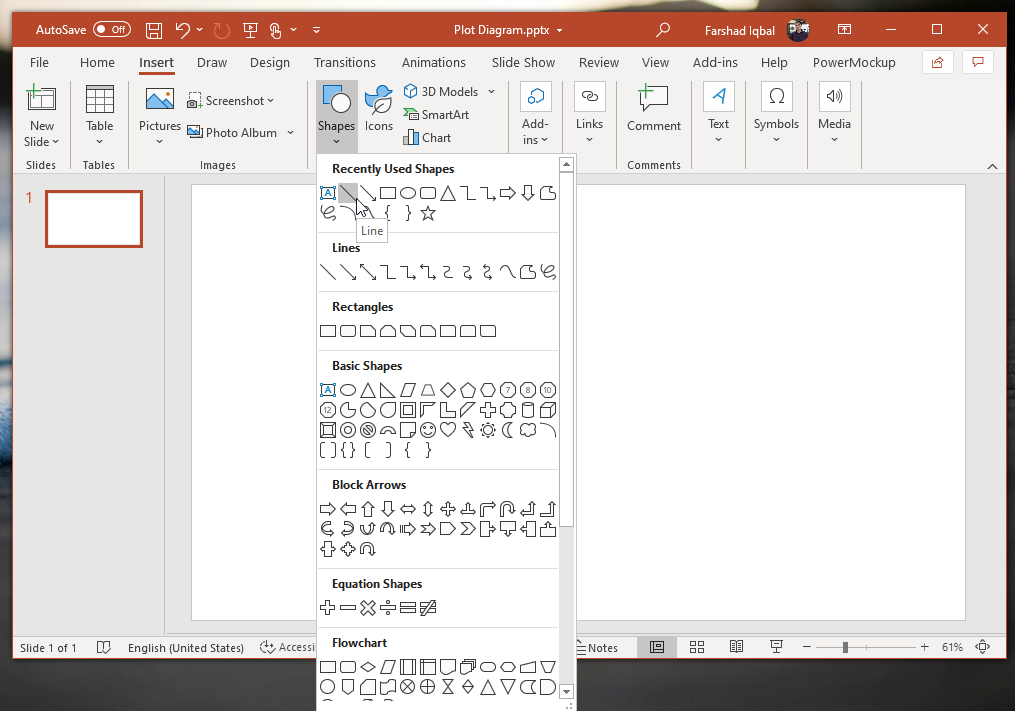
Step 1: There are different PowerPoint shapes that you can use for making a plot diagram. In this case we will use lines using the Line shape via Insert -> Shapes -> Line.
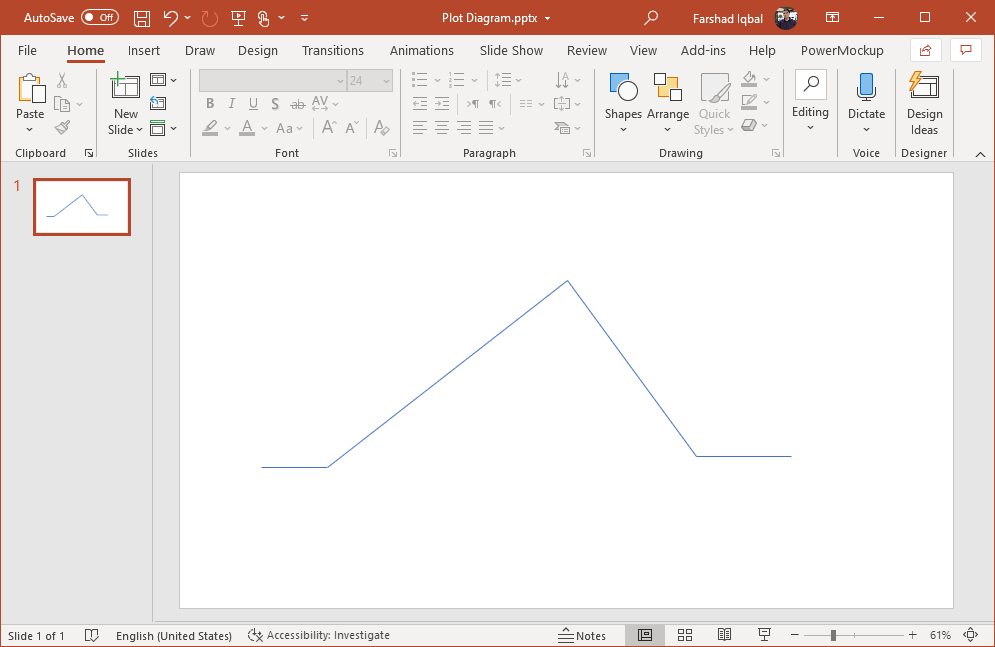
Step 2: Drag the lines to create a mountain shape. You will have to use multiple lines to draw the mountain (as shown below).
Step 3: You can add text to mark the five-parts of the dramatic structure, starting from the exposition, followed by rising action, climax and return or fall downwards in the form of falling action, which is then followed by the resolution.
Method 2
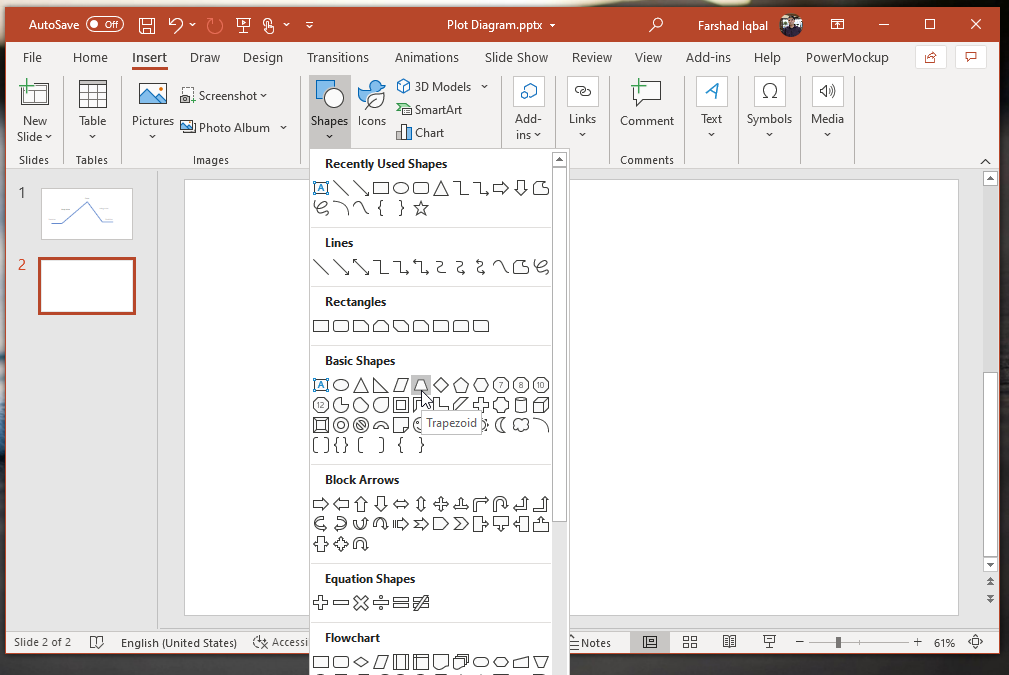
Step 1: You can also use the trapezoid shape to create your plot diagram via Insert -> Shapes -> Trapezoid.
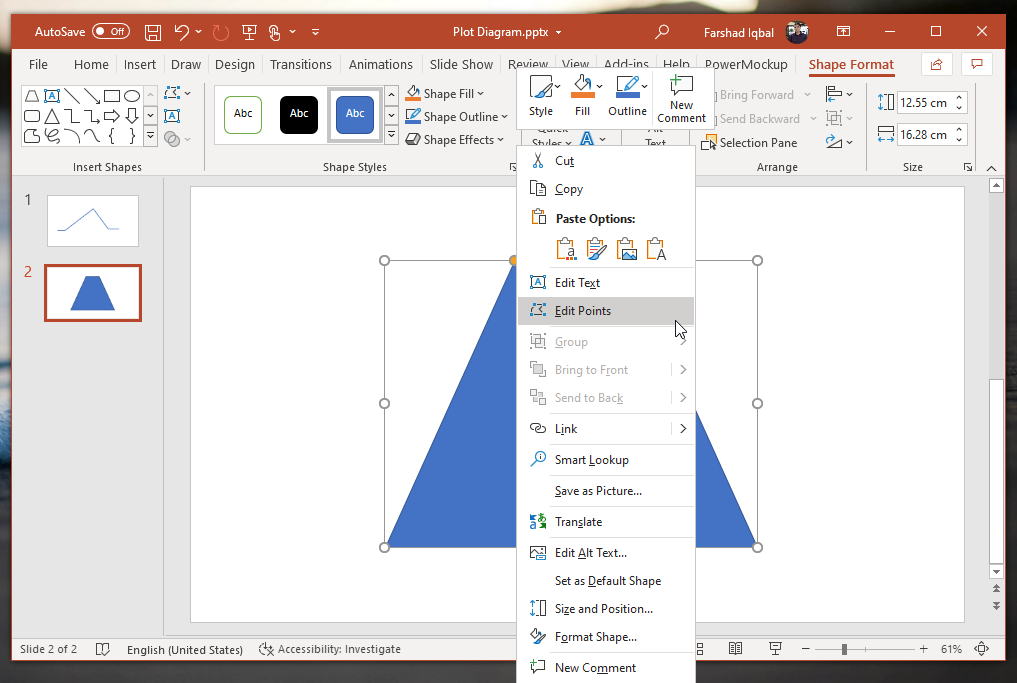
Step 2: Right click on the trapezoid shape and select Edit Points.
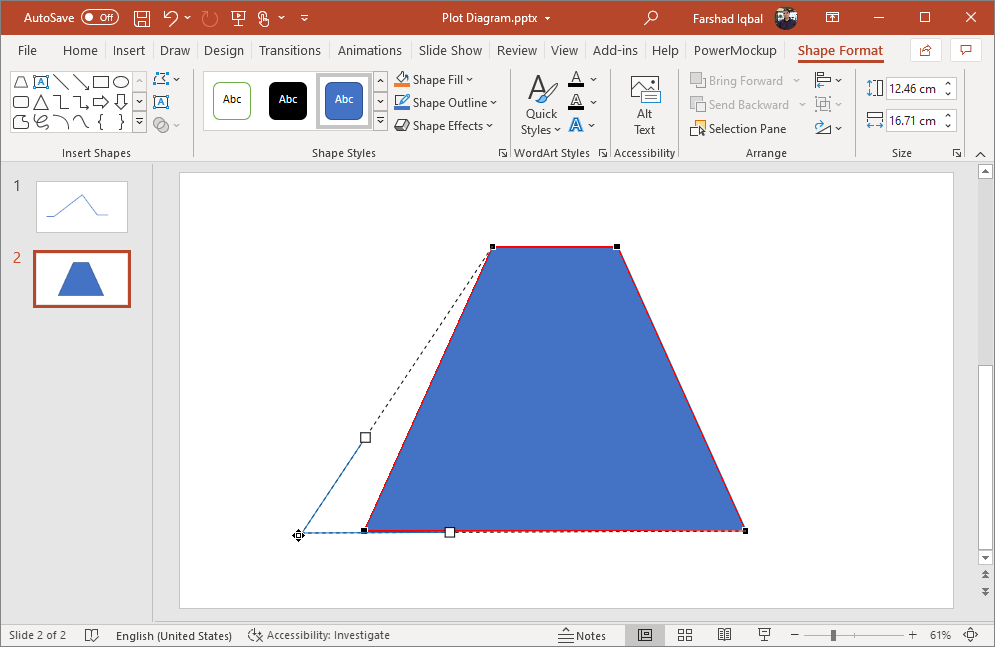
Step 3: You can drag around the trapezoid shape to give it a shape suitable for the plot diagram.
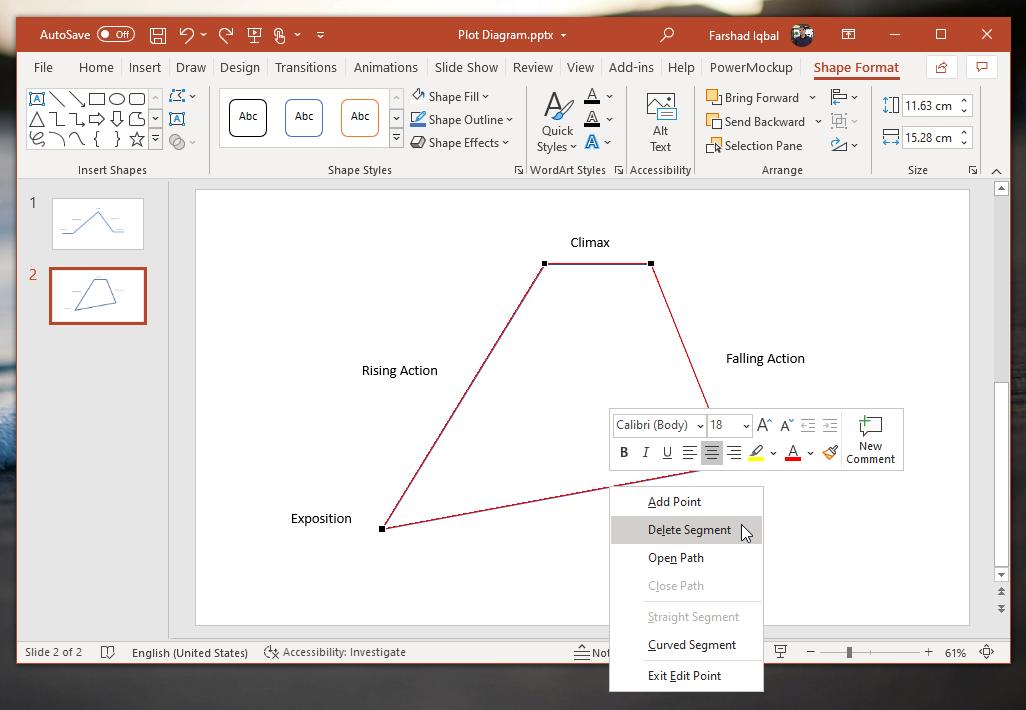
Step 4: You can recolor the middle of the trapezoid shape according to need and delete parts of it to give it a mountain like shape. To do this, right-click the shape and select Delete Segment to remove the parts you intend to remove.
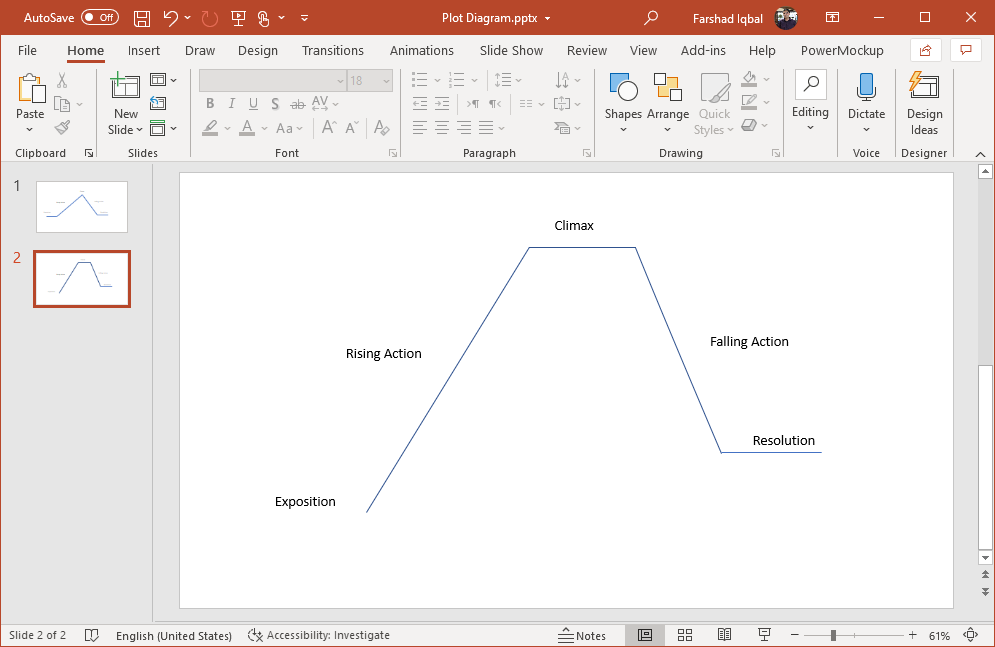
Step 5: You can label your trapezoid shape to give it a plot diagram narrative by adding the five-part arc.
3+ Plot Diagram PowerPoint Templates
If you want to use ready-made Plot Diagram PowerPoint Templates to make your job easy, you can check out the following plot diagram templates to design your slides. They are compatible with Microsoft PowerPoint and also with Google Slides presentations.
1. Free Plot Diagram PowerPoint Template
Click here to view Free Plot Diagram PowerPoint template
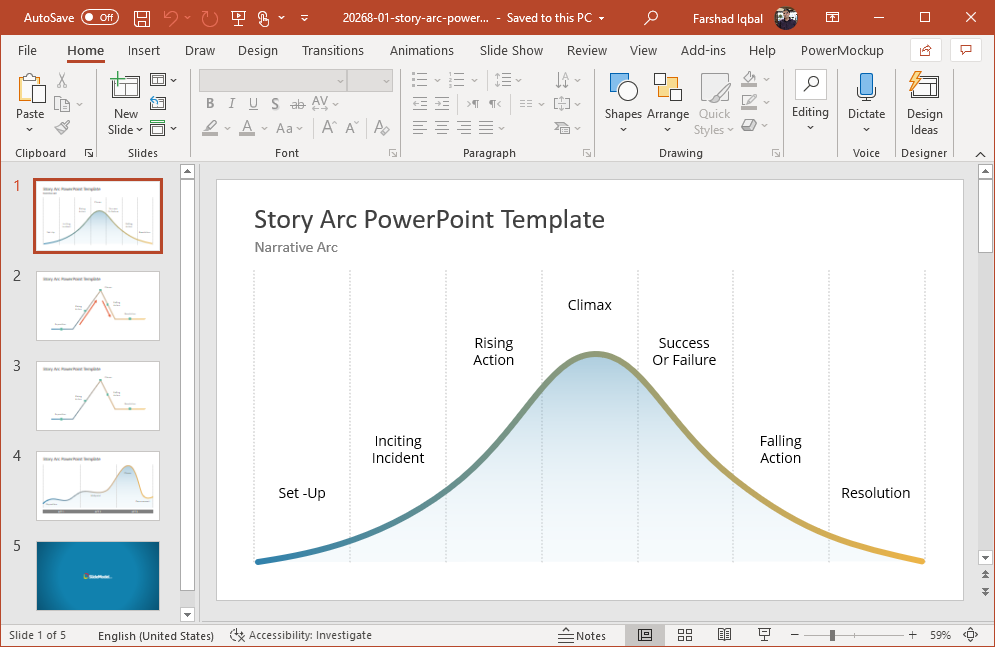
2. Narrative Arc PowerPoint Template
This template provides four plot diagram slide designs which can be customized to suit your story arc needs. The storytelling arc designs given in this template are easy to edit and can be instantly used within a PowerPoint presentation. You can also create entire presentations by duplicating the slides and editing them according to your requirements.
Go to Download Narrative Arc PowerPoint Template
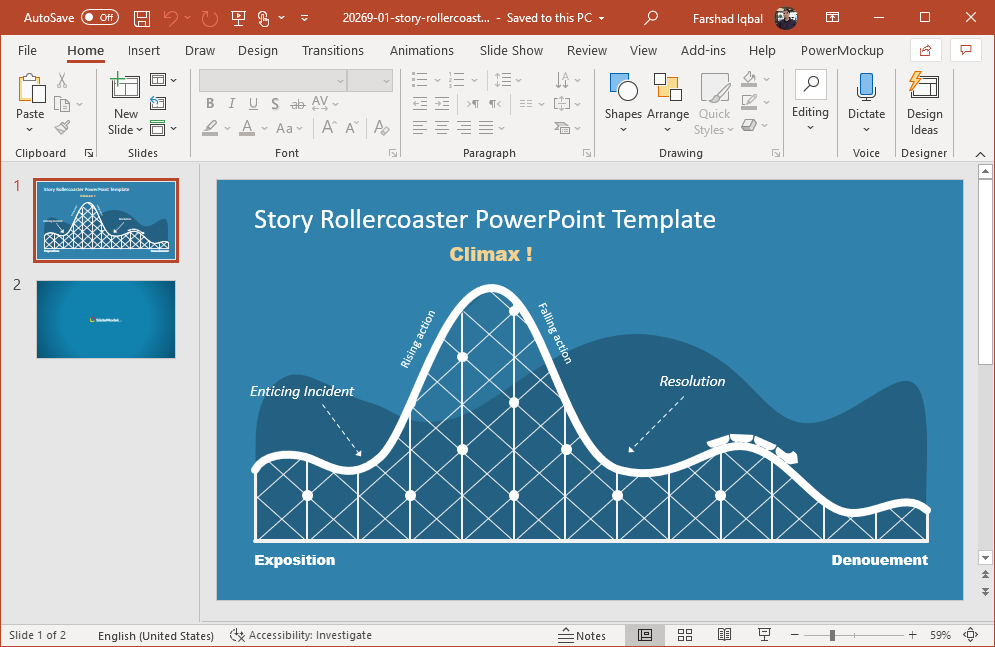
3. Story Rollercoaster PowerPoint Template
This template gives a roller coaster twist to the plot diagram by providing an interesting layout that can be used for making plot diagrams with a mountain like arc, which has been placed like a roller coaster. This is a single slide template, which gives the option to edit individual slide elements for ease of editing and design of your basic story arc explanation.
Go to Download Story Rollercoaster PowerPoint Template
FAQ
The 5 elements of a plot diagram include the exposition, the rising action, the climax, the falling action, and the resolution.
Final Words
Plot diagrams can appear intimidating to construct, however once you play around with PowerPoint shapes, constructing one might not even take too long. You can always make your job easy by optimizing for readymade templates which would remove the hassle of designing your plot diagrams and using the right color combination to highlight them.
