Advertisement
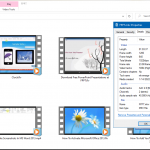
How to Lock a PowerPoint Presentation
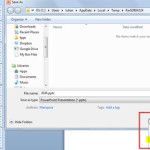
If you need to share a PowerPoint presentation online but don’t want the people who get it to be able to edit or modify the content, then there are many different ways to lock PowerPoint presentation from editing. In recent versions of PowerPoint you can configure the general options at the time you save a …