Slides for Comparison using 3D steps in PowerPoint

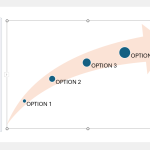
Sometimes we need to make comparisons in PowerPoint. Imagine we need to compare between 3 different options. The standard way to do this is using 3 columns and spread them into the slide. However, we can use some nice 3D shapes in PowerPoint to make comparison slides easier to understand. For example, if you play …


