Monthly Expense Chart Template For Excel Online
Keeping track of your personal finances, especially when it comes to your expenses, can help you prevent overspending. Knowing how much you spend on certain things will also tell you if you are spending your money wisely on things that matter, such as rent and utilities, or if you can cut down on your shopping or on your weekly binges.

Having a way to keep track of your spendings is one of the most important keys to avoiding debt or even bankruptcy. Much like health-conscious people are using weight-loss trackers or health and diet journals, you can also find expense tracking as a way to be financially healthy.
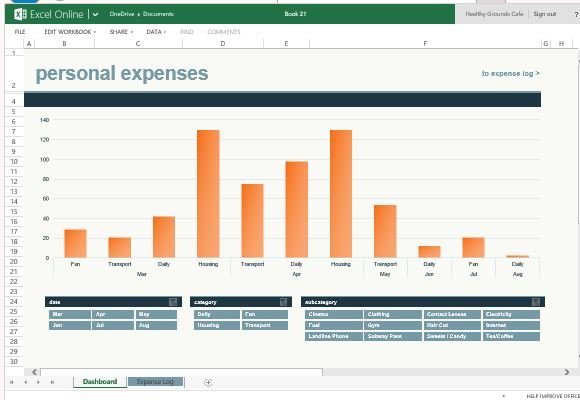
The Monthly Expense Chart Template for Excel Online is a highly functional and reliable template that you can use to log your daily expenses and group them according to categories. This template allows you to specify transactions and log them according to dates as Excel automatically buckets them for monthly viewing using beautifully designed charts.

This Excel Online template contains two worksheet tabs, namely Dashboard and Expense Log. The Dashboard contains a huge bar graph of the expenses. Below are viewing buttons such as Date, Category and Subcategory that allow you to select what type of information you want to view. This way, you can go back to your monthly expense history and view which month or expense category or subcategory to see how you have spent your finances in those areas.
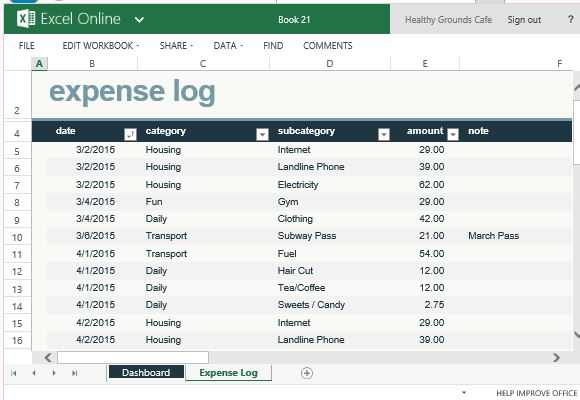
The Expense Log tab is where you input your expense information. Here, you will log your expenses everyday. You type in information such as Date, Category, Subcategory, Amount and Notes. All this data is automatically displayed and updated on the Dashboard Tab.

To keep track of your expenses, download this free template from the Office Online Templates portal.
Go to Download Monthly Expense Chart Template for Excel Online
