Interact, Share & Present Data From iPhone Or iPad With Roambi Analytics
Every now and then something happens that changes the way the world works, revolutionizing everything as we know it, a phenomenon that has the ability to make the world a better place. One such phenomenon is the advent of the application Roambi Analytics.
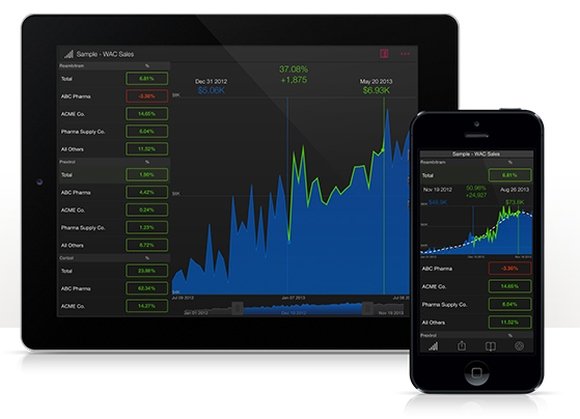
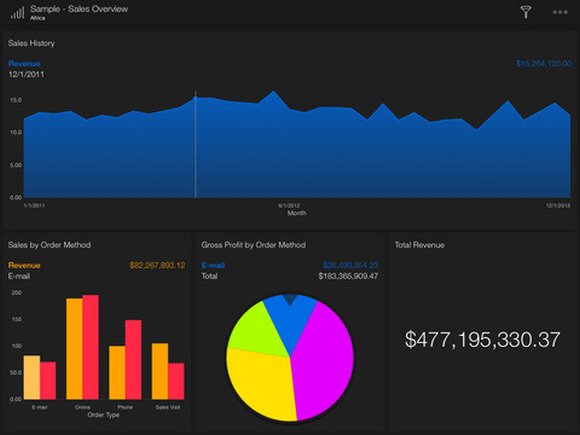
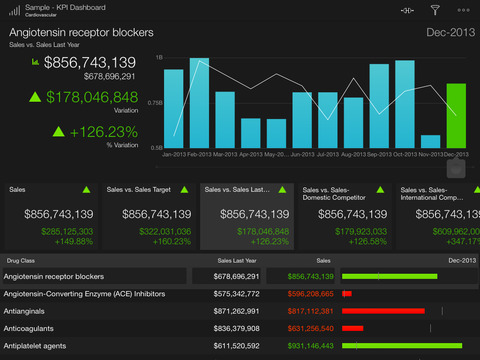
This application has been built specifically for the conversion of raw data to graphical representations in no time. From charts to Venn diagrams to graphs anything and everything can be plotted with the help of this amazing application built for the iPhone and iPad.

The Application gives the users a smooth amalgamation of superb visual elements with the superior quality retina display of the iPad. The application is used by almost all of the top organizations and the reason for this is the ease of operability and the well-crafted interface it offers apart from others.
The following make it an amazing application and a must have for any individual dealing with huge chunks of raw data that needs to be explained to an audience.
Easy To Use
The interface and the processes involved in creating graphical representations from raw data are as simple as it could be. The user can simply upload the data and then move on to choosing the style in which he or she wants the data to be represented. This hassle free application allows the easy conversion of data to graphics in no time.

Well Crafted
The application is superbly crafted and users can have a gala time the moment they register for the trial. The interface design is at par with the best, the ease of access and the well-structured hierarchy make the application a must have.
Superb Designs And Elements
The application provides the users with a multitude of options to create the graphical representation of the data that is fed into the application. There are a number of well-designed and dynamic designs and elements present in the application that give data representation a new high.

