Infographics: Search, Upload And Share Visualizations At Visualizing.Org
Infographics and data visualizations are an interesting way of displaying complex data in an easy to understand manner. Visualizing.org is a platform where people can find, share and upload data visualizations and infographics. This website is not only helpful for people who wish to showcase their visualizations but can also be helpful for organizations and educational institutes for acquiring interesting visualizations.
The website not only provides a wide range of infographics and data sets that can be viewed and shared online but also serves as a good place to find data and graphics for PowerPoint presentations, seminars, classroom lectures and the like. Furthermore, educational institutes can engage students in different types of challenges and become Academic Partners to collect student projects in galleries.
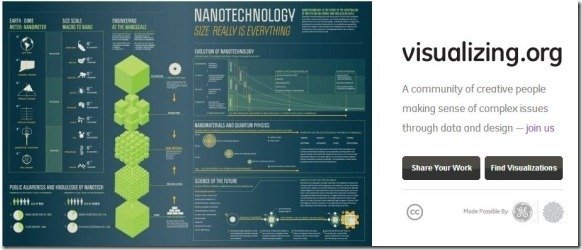
The Homepage of the website provides some featured infographics with options to share and find visualizations. You can also sign up and select the Upload Your Work option to save and share your own content.
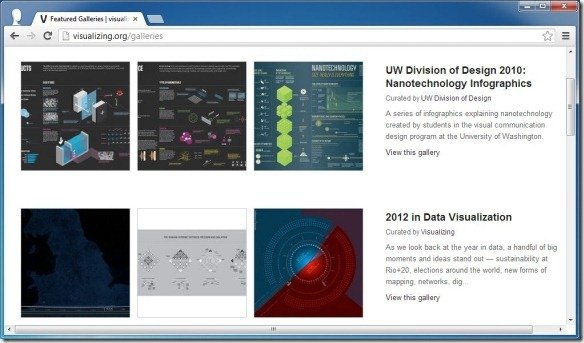
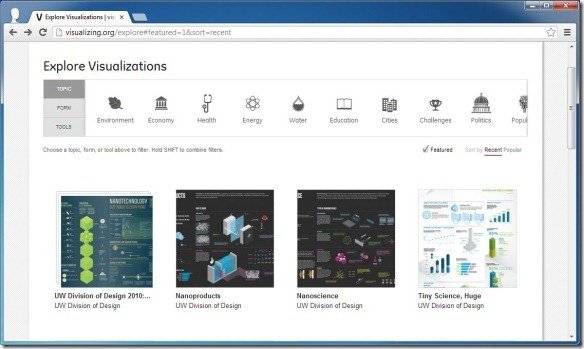
The Visualizations tab provides three options, i.e. Explore, Featured galleries and Upload Your Work. The first two options can be used to find appropriate infographics regarding specific topics. For example, the Explore option allows searching for visualizations according to category. The available categories include; Environment, Economy, Health, Energy, Water, Education, Cities, Politics, etc.
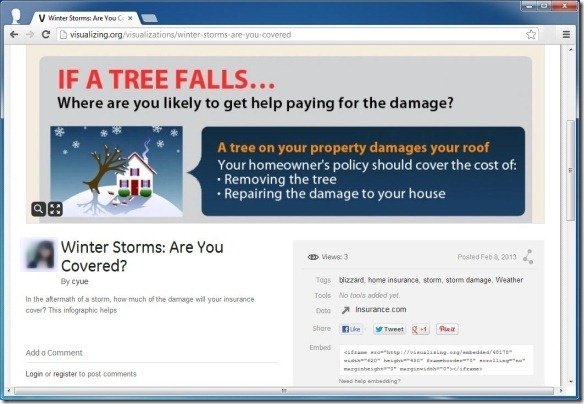
When you select a graphic you are provided with various sharing options to share the visualization on Facebook, Twitter, Google Plus, Pinterest and via embed code.
The website also has sections for exploring Data Sets and data Channels. The Data Channels section provides data related to government organizations, companies and NGOs. Whereas, the Data Sets section provides specific data sets related to various topics that can help you download data in the form of spreadsheets and ZIP files. Such data can be quite useful for research purposes and help you quickly locate relevant content related to different types of subjects.
You can use the infographic ideas and visualization tools to make awesome PPT presentations with nice PowerPoint graphics.
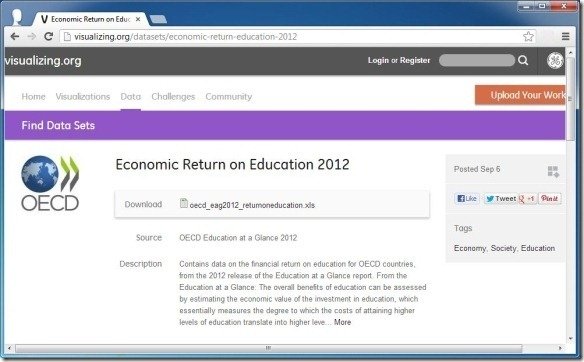
To look for data sets, infographics and visualizations, see the link given below.
Go to Visualizing.org
