How to Make a Zig Zag Line in PowerPoint
Last updated on January 3rd, 2025
PowerPoint presentations have become a cornerstone in the world of business, education, and communication. One underutilized element that can add visual interest and impact to your slides is the zigzag line. Whether you’re using it as a squiggly arrow or a wavy line, zigzag lines can represent various ideas and concepts in an engaging way.
Incorporating a zigzag or squiggly line into your PowerPoint presentation is a straightforward process that requires only a few steps. In this article, we explore how to do it.
How to Insert Zig Zag Lines in PowerPoint presentations?
Zig zag lines can be used in PowerPoint presentations in different situations. For example, if you are making a business presentation you may be interested to show a process flow and steps going back and forth many times.

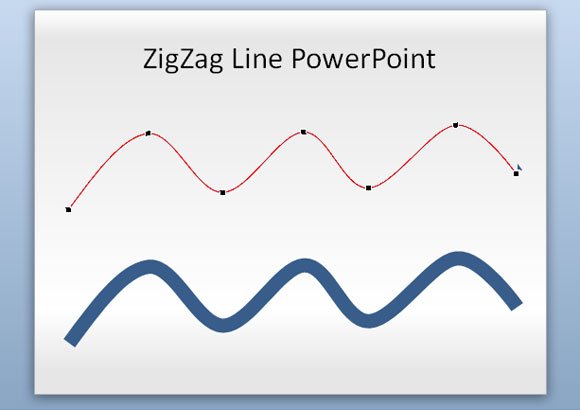
Zig zag lines can also be used in goals PowerPoint presentations, for example to show a final target but with internal steps. You can draw a zig zag line in PowerPoint using the curve shape.

In the example above we are showing you how to start drawing a curve in PowerPoint using the curve shape. Then you can change the line width to match the second line. Finally, rotate it with the green dot (selected) and then apply the perspective effect in PowerPoint.
To insert zig zag lines in PowerPoint, follow these steps:
- Open your PowerPoint presentation and navigate to the slide where you want to add the zigzag line.
- Click on the “Insert” tab on the menu bar, then choose “Shapes”.
- In the “Lines” category, find and select the “Zigzag” or “Wavy” line option.
- Click and drag your mouse across the slide to draw your line. You can adjust its size and orientation by dragging the small circles at its ends.
You can format the squiggly line and apply special effects to it, for example you may try filling the squiggly line with a gradient effect.
Now that you know how to add a zigzag line in PowerPoint, let’s discuss some compelling use cases that can potentially enhance your slide designs.
Use Cases of Zigzag Lines in PowerPoint Presentations
- Pathways and Timelines: Zigzag or wavy lines can serve as a visually appealing way to illustrate a pathway or a timeline. For instance, you can use squiggly arrows to point out different stages in a business model or to delineate steps in a workflow.
- Concept Visualization: Zigzag lines can serve as an abstract representation of different ideas. For example, you could use a zigzag line to depict fluctuation in data, instability, or the ups and downs in a journey.
- Emphasis and Highlighting: Zigzag lines can be used to draw attention to a specific part of your slide or to underline important information.
Business Models that can use Zigzag Lines
Zigzag lines can also be utilized to represent various business models effectively.
- Lean Startup Model: This model focuses on iterative product releases to gain valuable customer feedback. A zigzag line can be used to represent the pivot points in this iterative process.
- SWOT Analysis: In this model, the zigzag line can be used to separate the different elements (Strengths, Weaknesses, Opportunities, and Threats) making it easier for the audience to understand.
- Business Growth: A zigzag line could symbolize the ups and downs of business growth, emphasizing that the path to success isn’t always a straight line.
In conclusion, zigzag lines, whether represented as powerpoint wavy lines, squiggly lines, or zigzag lines, are more than just visual elements. They are versatile tools that can enhance your presentation’s impact and convey complex ideas in a simple, visually appealing way.
Additionally, you may wish to add a perspective style to make the line look like in the example above. The 3D line with zig zag can be decorated with an arrow or you can change the color to a gradient style to make it more realistic.
