How to Make a simple XY Scatter Chart in PowerPoint
In PowerPoint we can create diagrams and charts easily with a few clicks thanks to some of the built-in features for this purpose. For example, we can insert a chart into a PowerPoint slide or use SmartArt to make awesome graphics.

XY (Scatter) chart plot two groups of numbers as one series of X and Y coordinates. XY charts show the relatedness of two sets of data. If the data points cluster or bunch in a certain configuration that indicates that the two sets of data are correlated in some way. Scatter plots are used widely on statistics as well as business fields or in medicine and bioinformatics.
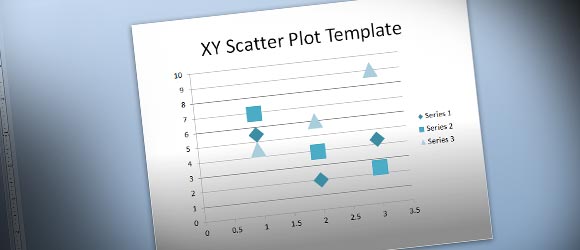
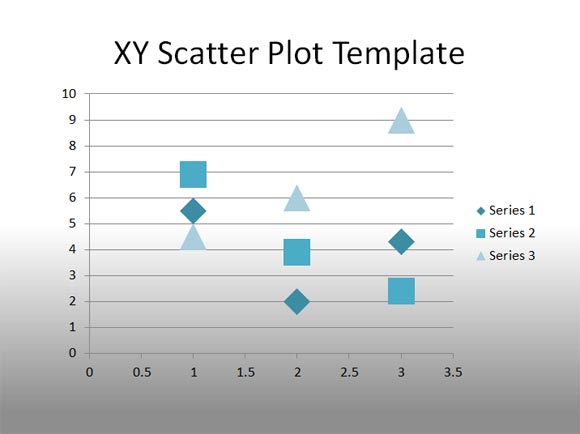
Here we will show you how to insert a simple XY Scatter Chart in PowerPoint 2010 so you can compare two different variables.
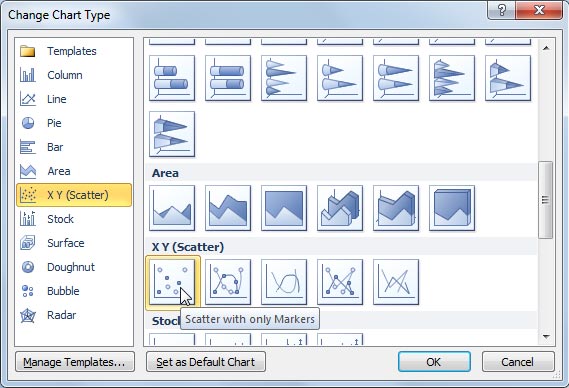
Go to Insert -> Chart and then select X Y Scatter tab from the left. Then look for Scatter with only markers and insert it.

Now you can edit the data associated with this Scatter Plot.

You can download free PowerPoint diagrams and templates for presentations including charts and other original slide designs and creative ideas for PowerPoint presentations.
