How to Make a Honeycomb Diagram in PowerPoint
Honeycomb diagrams are a great visualization tool for presentations. You can use a honeycomb structure to share ideas, concepts or represent relationships in PowerPoint.
Creating an Hexagonal Comb diagram in Microsoft PowerPoint is actually very easy if we use the Smart Art graphics. Here we will show you how to create a simple but useful Honeycomb diagram for PPT presentations.
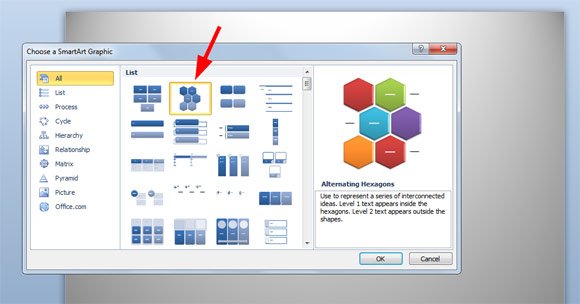
First of all we can insert the Alternating Hexagons Smart Art graphic as shown in the picture below. You can insert this graphic from the Insert menu, click Insert -> SmartArt and then choose the Alternating Hexagons diagram.
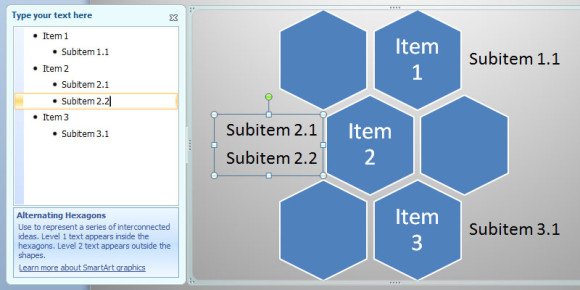
Then fill the items in the hierarchy list. In the root level you can enter the text for the internal hexagons while the second level of hierarchy will allow you to enter text outside the hexagons or honeycomb cells.
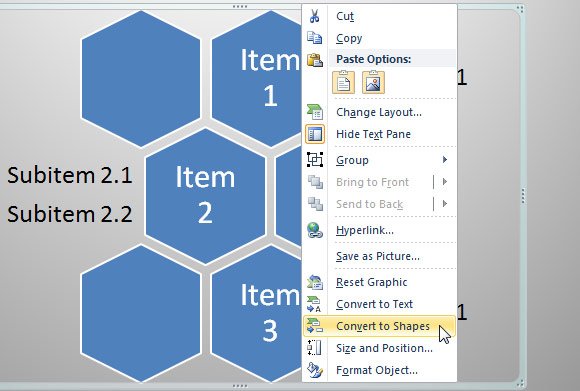
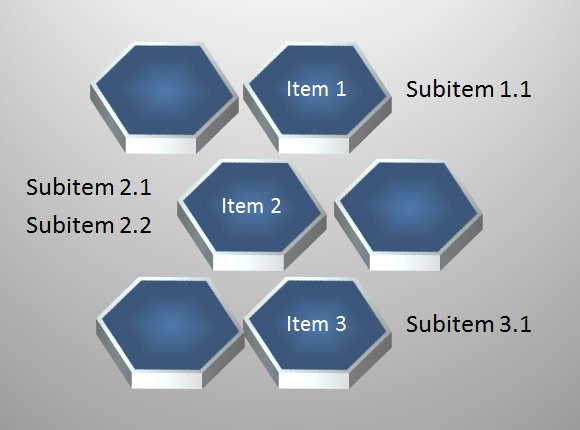
If you want to customize the resulting PowerPoint graphic you can convert the SmartArt graphics to Shapes. This allows you to customize the shapes easily, you can ungroup and choose only the honeycomb cells that you want to change the colors, for example if you need to highlight any concept or idea. You can also customize the fill options and change the 3D effects.
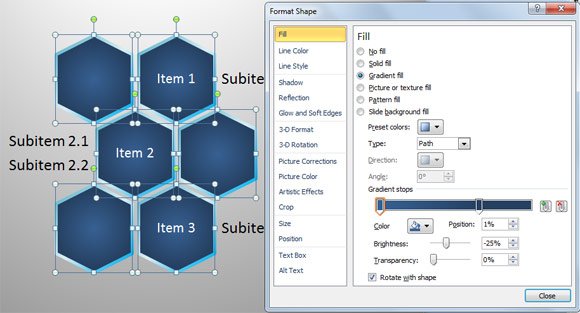
After ungrouping the shapes here you can see how we changed the fill options and added a gradient fill background and border.
Finally, we moved forward and created a 3D version of this honeycomb diagram. You can do this by changing the 3D Rotation and Format options.
This article explained how to create a simple but useful honeycomb diagram in PowerPoint. You can also create awesome diagrams in PowerPoint and Google Slides or download ready made PowerPoint templates and presentation design templates including other honeycomb background designs for PowerPoint like the free Honeycomb PowerPoint template with yellow and black background or this free Honeycomb PPT template.
