How To Make A Good PowerPoint Diagram On Target Market Identification
Last updated on September 25th, 2023
There are numerous SmartArt graphics that you can use for different purposes. If your business presentation, for example, is about certain steps like ‘Steps on the Identification of Target Market’ or even steps in scientific research, then there is a graphic like Descending Block List that you can use. Let’s explore some factors for making a good PowerPoint diagram on “Target Market Identification”.

Factors To Consider When Organizing Data in Your Diagram
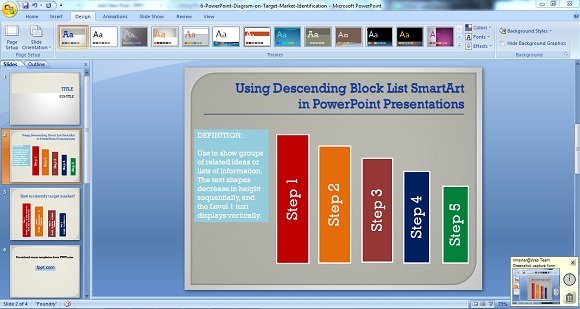
Based on the definition of the SmartArt, Descending Block List is used to show groups of ideas that are related. It shows a list of information in a descending manner wherein it can signify that the first step of the information presented in the highest block shows more importance than the other blocks. It can also signify that the first block should be accomplished first before you can successfully or effectively complete the information for the other blocks.
Actually, it is pretty obvious that you should be placing the more important information in the order of highest to the lowest since this way, it can help you present your business idea clearly and effectively. Needless to say, it makes no sense if you will place Step 1 on the lowest and last block, right?

Using Descending Block List For Making Target Market Diagrams
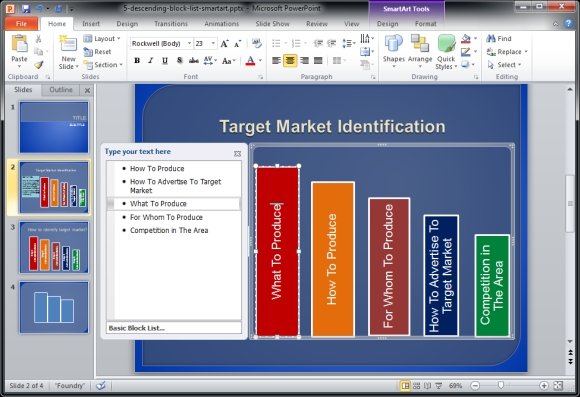
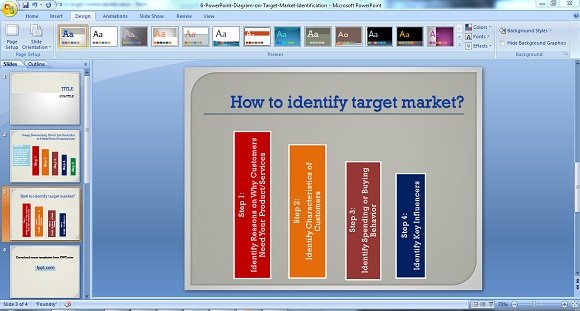
Taking for example the previous article on Using Descending Block List in PowerPoint Presentations, the SmartArt was used to present the steps on how to identify the target market. This information is crucial since lacking proper and accurate information of the target market will gravely affect the outcome of the business. In short, it will determine if the business will be successful or not.

Emphasize On The Need For Your Product Or Service
In the PowerPoint screenshot above, the first step is to identify the need of your target market and needless to say, there should be a good reason why people will buy your product or avail of your services. To simply put it, if the residents of a city or county travel 5 to 10 kilometers to buy gasoline in another county or city, then there is a need for you to put up a gasoline station right in the business area, where it can be accessible for the residents, right? As there is a need for a gasoline station, hence clients will surely buy from you than endure the inconvenience of traveling a few good kilometers to another city.

Apart from this, you can also convert wants into needs, which is one of the backbone of marketing. For example, there is a clamor for healthy foods and products since many of the residents in your city are suffering from lifestyle diseases. Hence, juicing of vegetables was becoming a trend which later on became a lifestyle. However, juicing can be time consuming especially for those who are always on the go or those who got a tight schedule and squeezing in a few minutes to juice vegetables is not convenient. With this, you can offer and sell freshly juiced vegetables in bottles of tetra packs. To simply put it, your business will be centered on want they want, which is convenience in juicing vegetables, to what they need, which is freshly juiced vegetables that is conveniently packed and available to buy and drink anytime of the day.
Using Other SmartArt Graphics To Make Your Presentation More Effective
For the other steps, you can use other graphics to help you deliver the information clearly and effectively.

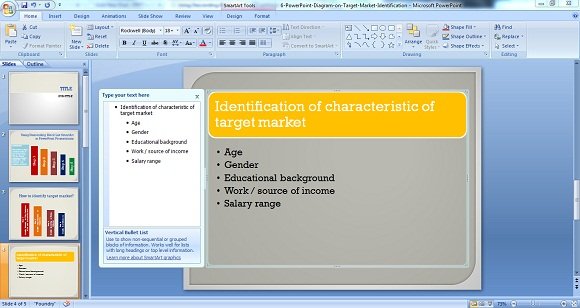
The SmartArt graphic shown above is the Vertical Bullet List and going by its definition is used to show or present information that is non-sequential or cannot be shown in sequence. This graphic is perfect for a long list of information. Take for example Step 2 on the Identification of Characteristic of Target Market. The said step involves several items like age, gender, educational background, work or source of income, salary range and other basic information that may or may not affect the buying or spending behavior, which is presented in Step 3.
It only follows that those who are receiving salary will be spending on more expensive items or that their lifestyle is more expensive that those who are receiving less. Hence, knowing the information on the salary range of the target market will give you an idea on where they usually go to buy or shop and how much are they spending on such products.
For Step 4, on the other hand, identification of key influencers will help you know on who are the people that may encourage the target market to buy your products. A famous celebrity who underwent and survived a health issue may be a good influencer to promote your new product on vegetable juicing packed in bottles or tetra packs.
In a nutshell, using different types of SmartArt in your PowerPoint presentations will help you present your ideas clearly and more effectively. If you are interested in specific diagrams to use in your target market slides, we recommend checking out the target diagram templates for PowerPoint & Google Slides.
