Customer Profitability Analysis Template for Excel
Last updated on March 3rd, 2025
Customer profitability is the profit that a company makes in serving a particular customer or client over a specific timeframe. This is the difference between the customer revenue and the costs of having business relationships with a specific customer.
Many companies do customer profitability analysis to determine which customer relationships are better or worth sustaining than others, as there are customer relationships that are unprofitable.

Prepare a Customer Profitability Analysis Report
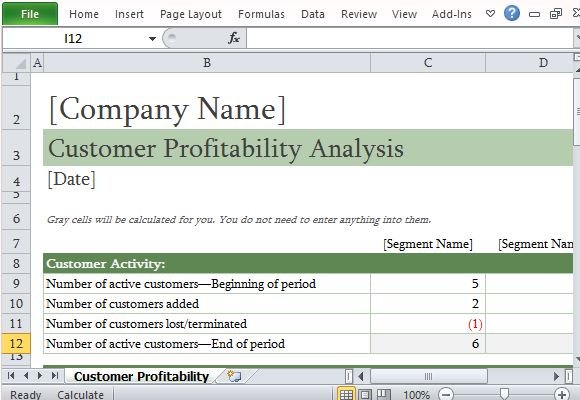
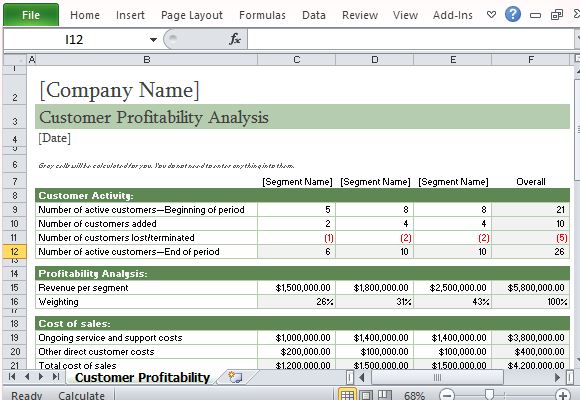
This article will show you how to easily perform a customer profitability analysis using this ready-made profitability report template for example. This Customer Profitability Analysis template for Excel is a free spreadsheet that works best with Excel and has backward compatibility with earlier versions. Here you can see a profitability report example.

With this Excel template, you can easily determine how much you will earn and benefit by taking care of particular customer relationships. This template also tracks active customers, revenue from each customer within a given time period, and cost of sales per customer, among others. The main analysis category are Customer Activity, Profitability Analysis, Cost of Sales, Other Costs, and Summary Metrics.
Use Sparklines and Automatically Generate Visualizations
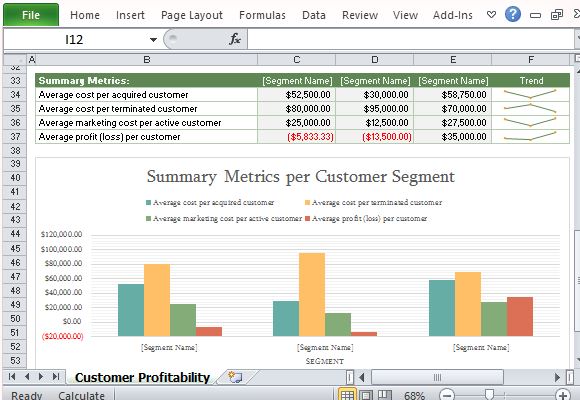
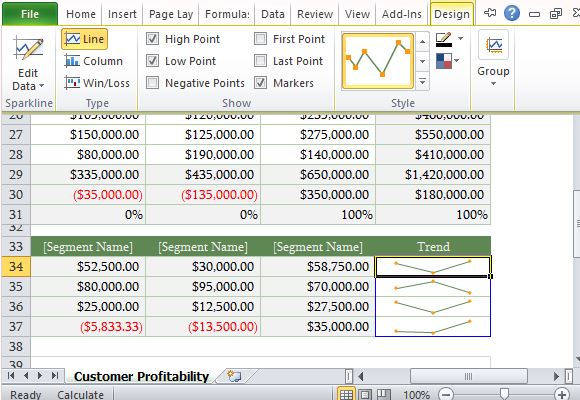
The Summary Metrics table comes with a Trend represented by Sparkline Tools, which are small, intense, word-sized graphics, also known as micro-charts. The Sparklines make it easy for you to visualize your Summary Metrics, which contain average costs and profit data.

Aside from this, another feature of this customer profitability Excel template is the Summary Metrics per Customer Segment, which comes in bar chart form, making it easy for you to see analysis and trends at a glance. You can also conveniently insert this chart into other reports or even in PowerPoint presentations to add an interesting and visual representation of otherwise lengthy and tedious numeric data.
Both the table and charts come with formula and are linked together to show results instantly as you type in your information. This way, you can create a beautiful report that contains all the data necessary for you and your company to determine profitability according to your customer segments.

Alternatively, you can browse our other Excel templates with creative examples for different uses.
