How to Create Clickable Charts in PowerPoint
Last updated on September 4th, 2024
PowerPoint presentations look impressive if the elements used in the slides are interactive. Charts, histograms, bar and proper implementation of animation within two slides gives you the ultimate eye-candy that, everyone at your work or school would love to watch. Attaining such level of interactivity is not that simple and requires a good knowledge of Microsoft PowerPoint. Today, taking one step ahead, we are gonna take a look at how to create clickable charts in PowerPoint.
In order to Create clickable charts, we need to use triggers. A trigger allows you to place an animation sequence, sound or a movie when particular object such as charts, in this case, is clicked. In an example below, we are gonna trigger a text box as the user clicks on bar.
I assume that you have the clustered column chart ready with you. You can just use Oomfo to design Awesome Interactive charts quickly.
Create clickable charts in PowerPoint
How to make interactive charts in PowerPoint? Here we will show you a way to make your charts clickable, which will add interaction to your presentations.
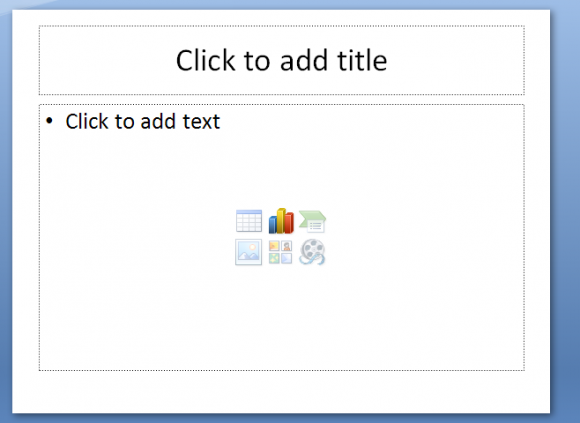
- Change slide layout to hold a chart and add a design template.
- You can simply change the color scheme if you don’t like the default one.

- Now, get rid of unnecessary additional stuff such as gridlines.
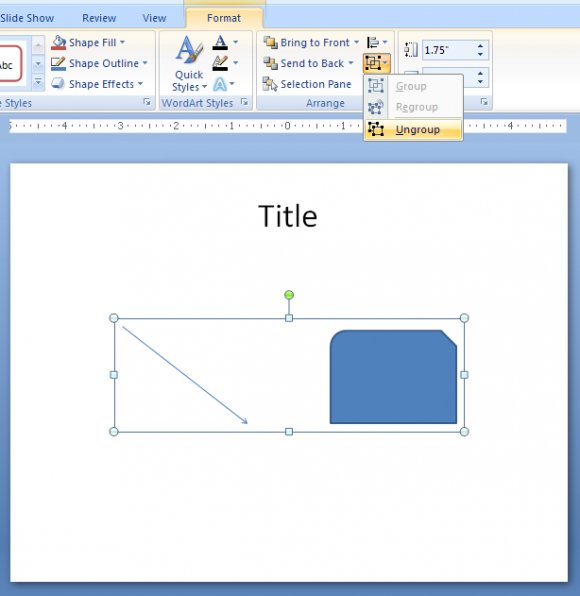
- Ungroup the chart twice by right clicking on the chart (Right Click>Grouping>Ungroup)

- This will certainly result in loss of data sheet.
- Now, the end result of this tutorial is when we click on certain bar, it should result in displaying text bubble.
- Ideally, put different colors for different bars as they will help effectively in getting our final result.
- Now, to add the trigger, select all the animations that you want to as a result of trigger.
- Once you select them, hit <enter> and effects options dialogue box will appear.
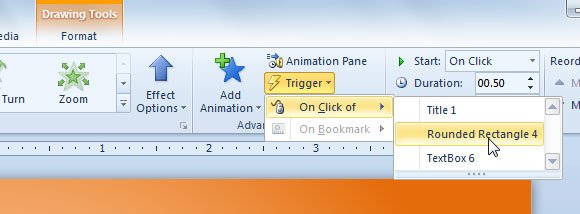
- Under animations tab, click on “triggers” and “start effect on click of”.

- Select the name of the bar which you want to click on in slide.
- In the animation pane, you’ll have a text box with the name of the rectangle.
Continue to add respective triggers for rest of the text boxes.
Advanced Features: Wiping out Text Boxes
Now, till now, what we have achieved is text boxes for triggers but we haven’t wiped them off. In short, text boxes remains on the screen throughout the time. In order to wipe them off, we will need to set up exit animations for rest of the bars. For example, if I’ve four bars with the name A, B, C, D, we will add fade in effect for respective color of the text box and fade out for others.
In order to so, we will have to set up exit animations for each bar.
Example – Bar A – Red Text Box in – Blue, Pink and Green fades out.
Moving these triggers to top of the animation will also allow you to hide text boxes when none are clicked.
This way, you can create interactive charts with clickable elements in PowerPoint. You can also learn what are some of the best PowerPoint charts and apply these concepts yourself.
