How To Create 3D Quadrant Circle in PowerPoint For Making Business Diagrams
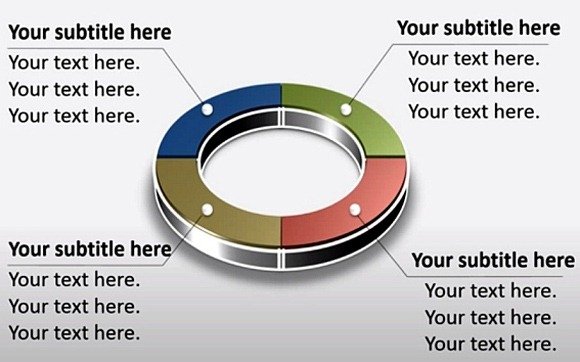
Circular shapes are often used for representing business diagrams and analysis. Quadrant circles for instance are many a times used when representing a SWOT Analysis, Pest Analysis, or a Boston Matrix.
By drawing a quadrant 3D circle you can easily create a professional looking business diagram and add some visual appeal to your presentation slides. Below is a video tutorial that shows how to create a business diagram by drawing a 3D quadrant circle in PowerPoint.
How to Create 3D Circular Diagrams in PowerPoint (Video Tutorial)
The following video tutorial by Presentation Process shows how to make a 3D Quadrant Circle in PowerPoint using the Block Arc shape. You can add textboxes along your quadrant circle to elaborate your diagram and easily convert the generic shape to present various business analysis models, processes, statistical information and the like.
3D Circular Business Diagrams for PowerPoint
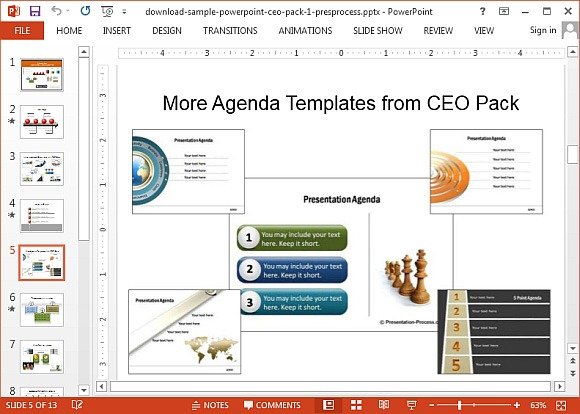
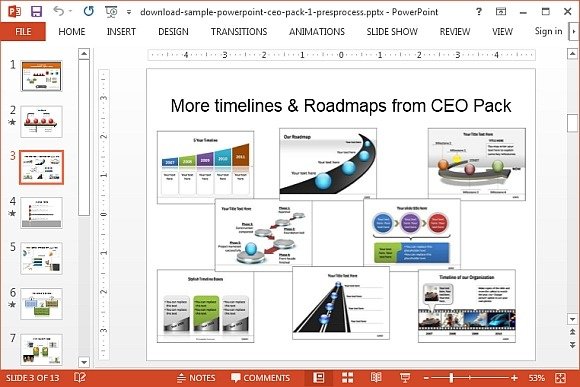
The PowerPoint CEO Pack is a presentation bundle by Presentation Process which provides a number of business diagrams in editable form. These include not only generic diagrams with placeholders but also 3D circular diagrams, slide layouts for making timelines and roadmaps, as well as layouts for depicting charts, agendas, comparisons, etc.
The CEO Pack comes with more than 750 slide layouts and therefore, you get the opportunity to choose from a wide variety of slide designs and editable diagrams. The slide layouts are easy to customize and the slide elements can also be readjusted via drag and drop.
The PowerPoint CEO Pack is ideal for people engaged in a number of professions and organizational departments, as the more than 700 slide layouts can be used by CEOs, CIOs, company managers, IT professionals, HR, Finance and MIS department officials, etc. You can order a CD or download this PowerPoint bundle via the link given below.
Go to CEO Pack with Editable Business Diagrams
Learn more here PowerPoint Charts & Diagrams CEO Pack


