Free J Curve PowerPoint Template
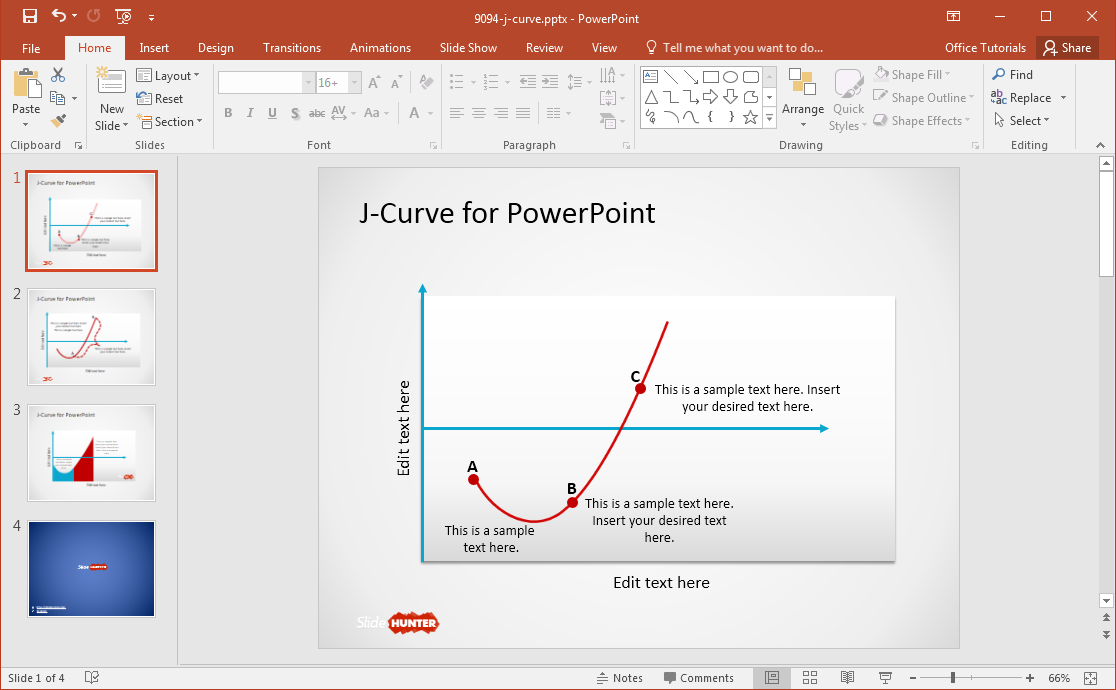
A J Curve diagram is used to represent trends for a country’s balance of trade, private equity funds, political revolutions, and even treatable symptoms for diseases. There are several reasons why you might require making a J Curve diagram, ranging from presentations for your economics class to presenting historical trends for equity funds in a board meeting. The Free J Curve PowerPoint Template can help you make professional J Curve diagrams with little effort.
Easily Create J Curve Diagrams in PowerPoint
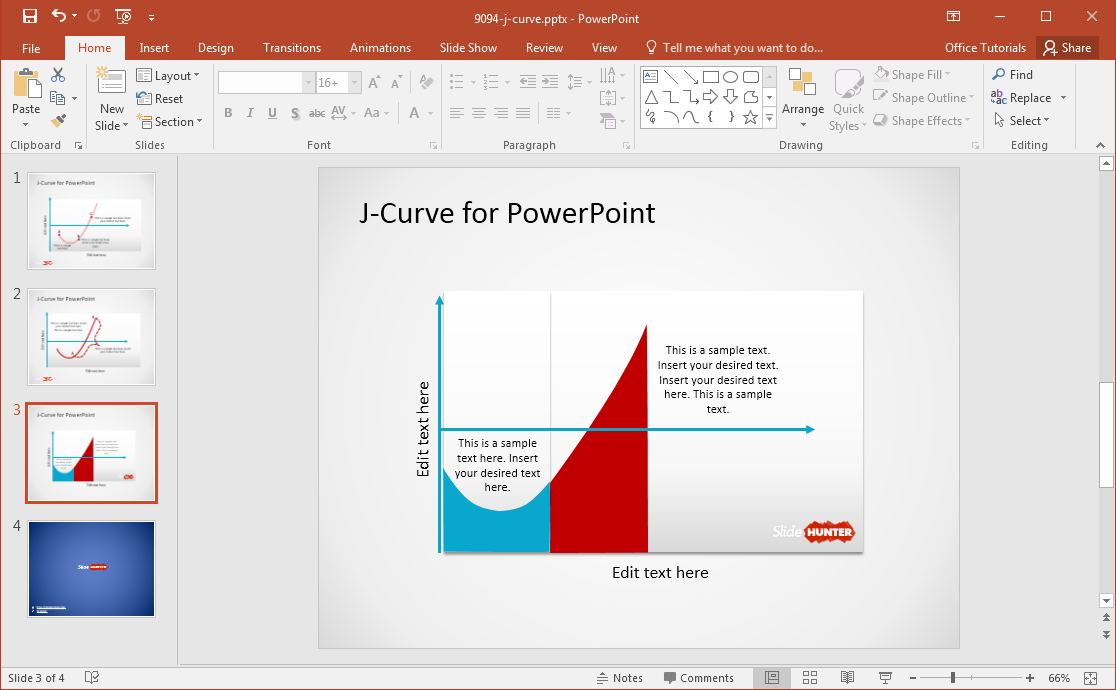
Unlike rigid templates that are a dime a dozen, this free J Curve template provides editable diagrams that you can easily edit within PowerPoint to represent specific trends. You can add a title and related text in the given text-boxes to customize the sample diagram slides to suit your specific presentation topic.

Editable J Curve Diagrams
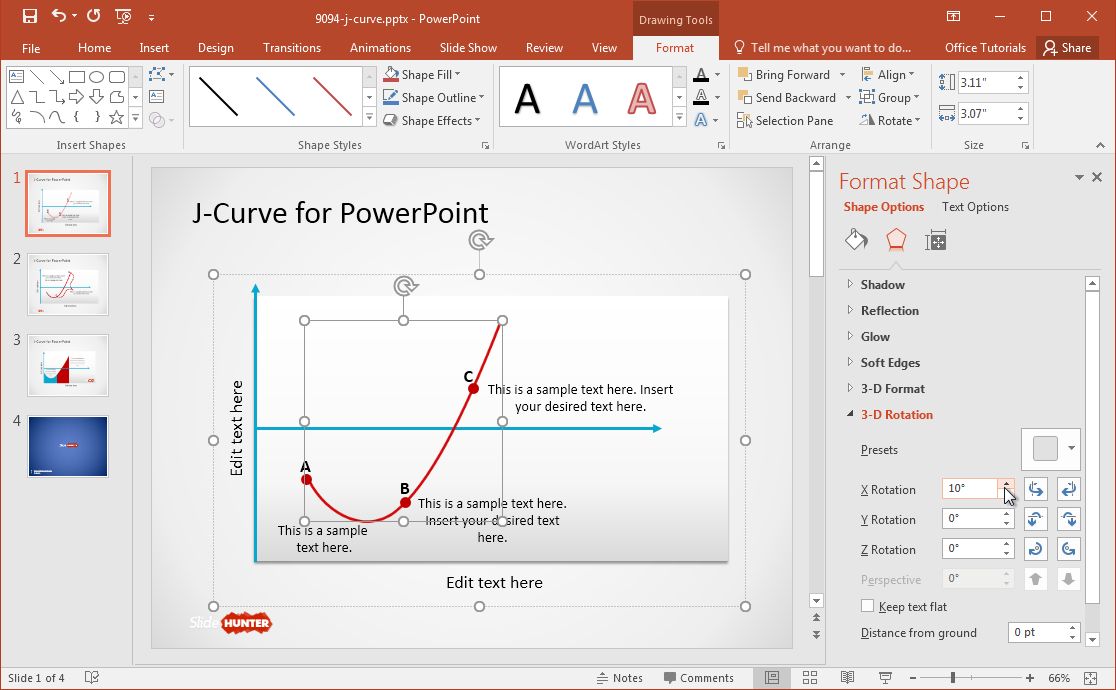
Editing the given J Curve diagrams is quite easy. You can not only use drag and drop to edit the diagrams but also change the color of objects, resize them, as well as rotate different parts of the sample J Curve diagrams to create slides that can help you perfectly depict specific trends.

Attractive Diagram Slides
What makes this free J Curve PowerPoint template really useful is not just the high level of editability but also the fact that the default slides are very attractive. The slides have been expertly crafted by professional graphic designers, which makes them visually pleasing. Furthermore, you can replace the default colors using Drawing Tools or change the theme of the presentation via Variants –> Background Styles from the Design tab to give the slides a color scheme of your choosing.

You can download this free J Curve PowerPoint template from SlideHunter, which is home to thousands of free PowerPoint templates for professional presenters.
