Explaining How Value is Added by using a ROIC Tree PowerPoint Template
For any strategical decision or if you are preparing a business PowerPoint presentation where you need to explain how value is added to the company, then a ROIC tree can be useful. A ROIC tree visualization can help you navigate and connect all the pieces across a company and see how the value is added in an EVA (Economic Value Added). This is similar to understand what is going from the customer perspective to operations to ROIC to generate value.
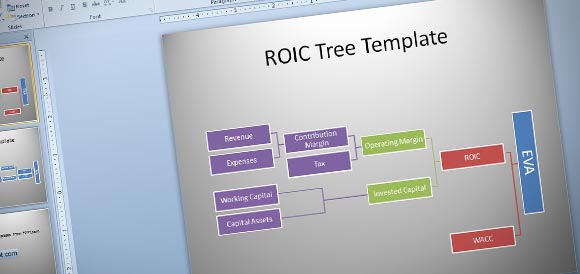
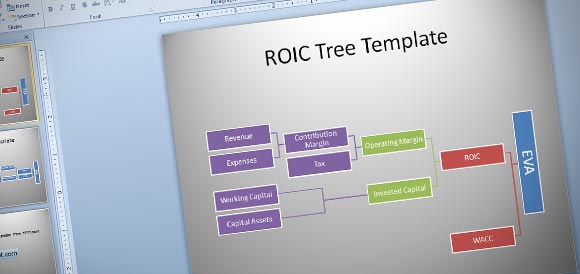
Here we will show you how to make a simple ROIC tree diagram in PowerPoint template by using a Multi Level Hierarchy SmartArt Graphic.
First, we start inserting the SmartArt diagram. Learn more about how to Insert SmartArt or you can do it from Insert menu. Make sure to choose the Horizontal Multi Level Hierarchy diagram. Don’t worry if it doesn’t look like in the picture, since we will flip it.
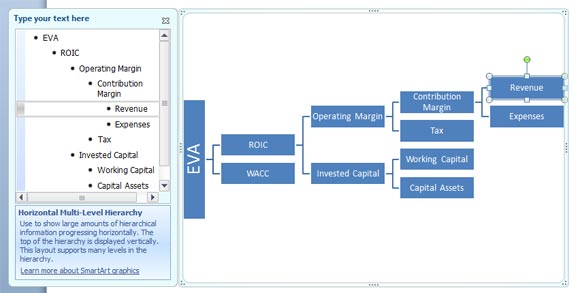
The trick here is to flip the diagram so it has the root node on the right instead of the left. Go to SmartArt tools menu and then Design, and here look for Right to Left button.

After you click this button, the diagram will be flipped horizontally.
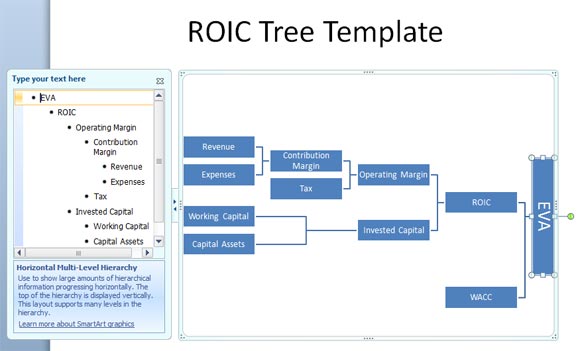
You can easily format the diagram and change the colors. For this purpose we will use different colors for each level.
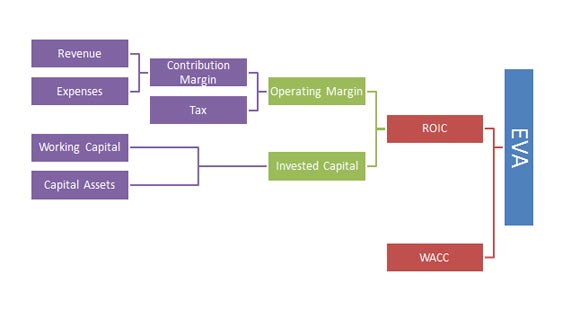
Finally, save the changes and you have designed a simple but effective ROIC template.
If you need more strategy diagrams or business diagrams for presentations then you can browse our related articles or download free business PPT templates and backgrounds.
Download this template for free from ROIC PowerPoint template (2316 downloads )
