How to Make Dynamic Charts in PowerPoint & Excel
There may be times when you need to link charts and tables between Excel and PowerPoint presentation, for example if you are preparing a report in PowerPoint for your monthly sales or a PowerPoint template that should populate the data from an Excel source.
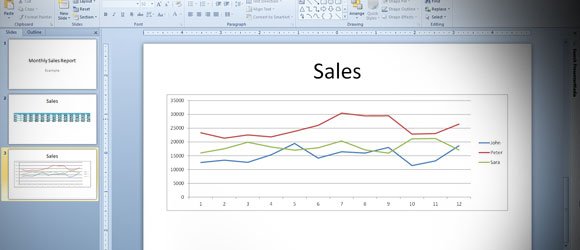
Here we will show you a very basic example to demonstrate how to embed charts and tables from Excel into a PowerPoint presentation.
How to insert a chart or table in PowerPoint that will update automatically when any change is made in the source Excel worksheet
First, we will start creating an Excel spreadsheet. You can add all the information you need as a source data, but also charts and other rich information.
Now, create a second document, this time a PowerPoint presentation. Here we will prepare our monthly sales report.
We will dynamically embed the charts and data from Excel into PowerPoint using the Paste Special feature and Microsoft Excel Worksheet Object. You can embed charts and data from Excel into a new PowerPoint or use any of our free PowerPoint templates instead of building the presentation from scratch.
As you can see, we have prepared a simple monthly report in Excel (on the left of the picture) and then you can see on the right the PowerPoint presentation where we will copy the charts and tables.
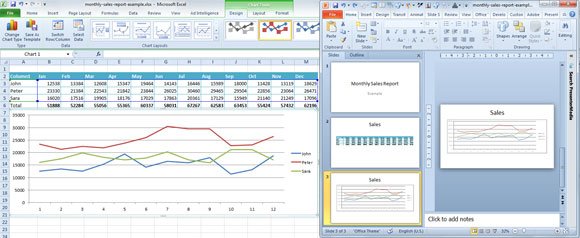
From Excel, use Copy CTRL-C to copy the table. Then go to PowerPoint 2010 and click on Home menu, and then open Paste popup to choose Paste Special.

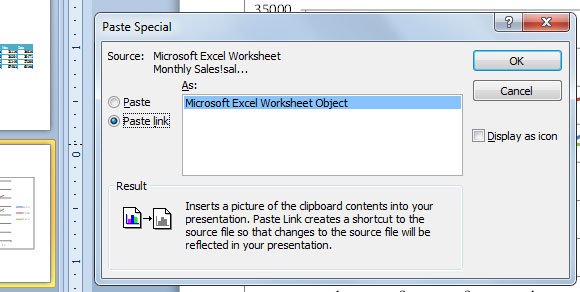
Here, choose Paste link and then as Microsoft Excel Worksheet Object. This will insert the dynamic picture in PowerPoint so every time the source data is changed, it will update the presentation slide with the new data. It is important to notice that you will need to apply any formatting and design into the source data table and charts because this won’t let you change the design in PowerPoint, but well, this is the trade off between having the data up to date and change the data every time the source document is changed.
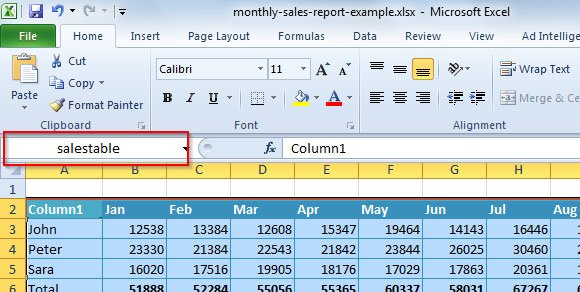
For simplicity, you can use the named range in Excel, in order to assign a name to the table. This will let you link the named range instead of individual cells. If you want to add more rows and columns in the future, then with the named range you can do it easier.
Finally, here is the PowerPoint with the data copied from Excel.
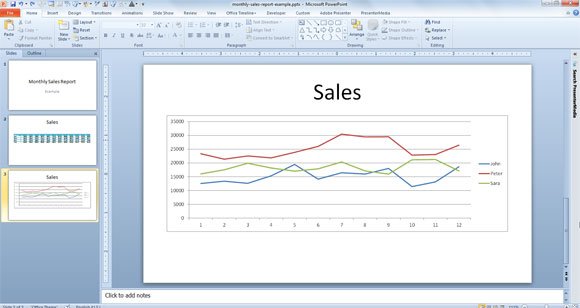
You can of course do more and use Pivot Tables to make advanced reports in Excel before you copy the data to PowerPoint presentations.
For example, you can make a Pivot Chart Active in a PowerPoint Slide using this approach or insert a pivot table in PowerPoint .ppt presentation. This way, you can link Excel to PowerPoint.
Simple Monthly Sales Report PowerPoint Template Example (2640 downloads )You can download free monthly sales report PowerPoint templates and other sales report PPT templates for presentations.
