Designing Graphs in PowerPoint 2010
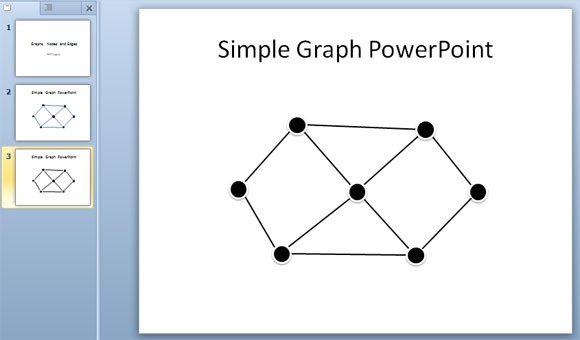
In mathematics and computer science, graph theory is the study of graphs. A Graph is a mathematical structure used to model pairwise relations between objects from a certain collection. Indeed, the tree structure representation are a type of graphs having a root and leaves. A graph is a collection of vertices (nodes) and edges that are connected between pair of nodes.

A graph can be undirected or directed. This slightly difference can be clarified in the following way. Undirected graphs means that there is no distinction between the two nodes associated with each edge. On the other side, for directed graphs the direction of the edges to nodes (usually represented with arrows) has a special meaning.
There is a convention about how to name graphs. For example, you can create a k-graph where k is the number of edges. Graphs can be used to describe complex algorithms but also simulate a flow diagram or design Bayesian Networks or Decision Graphs.
In PowerPoint 2010 we can create nice graph diagrams with nodes and edges and use shapes and lines to represent the nodes and connectors. Since we will be connecting edges we can use simple lines (with curves or not) and then point and connect every edge to a node.

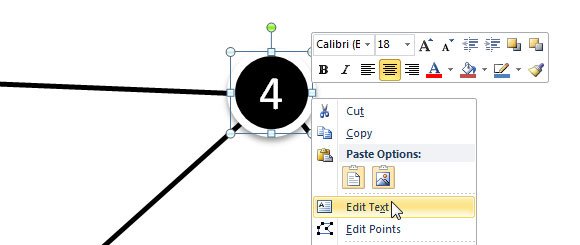
You can also add text to the nodes in order to numerate each node using a sequence of numbers. Some graphs require to have numbers or text so in order to do this you need to right click the node and click on Edit Text.

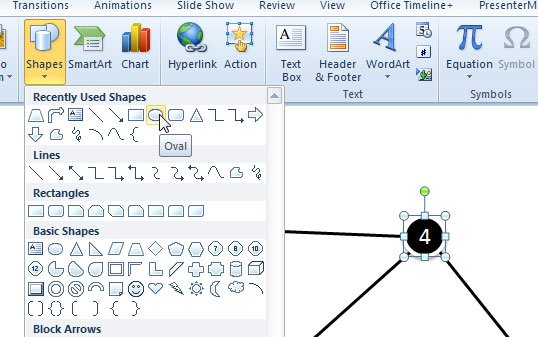
To design the graph, start adding new oval shapes to the slide and then connect each oval with arrows.

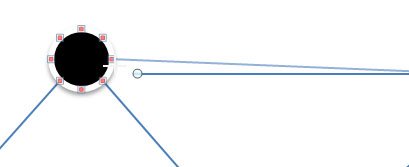
Connecting edges to nodes is possible if you add a node as a circle shape. This way you can enable the anchor points when connecting the arrows (edges) to the nodes. Otherwise, it won’t be possible to connect the start or end of an arrow in PowerPoint.

Designing graphs with edges and nodes may have lot of different applications but definitely if you are preparing a class for a group of discrete mathematics students, learning how to design graphs diagrams in PowerPoint is a must. You can make awesome graphs diagrams for your presentations in PowerPoint or PowerPoint templates.
This video below will help to understand how to apply the technique above to make awesome graphs in PowerPoint with nodes and charts.
