Creating Sankey Diagrams in PowerPoint 2010 (Free Template)
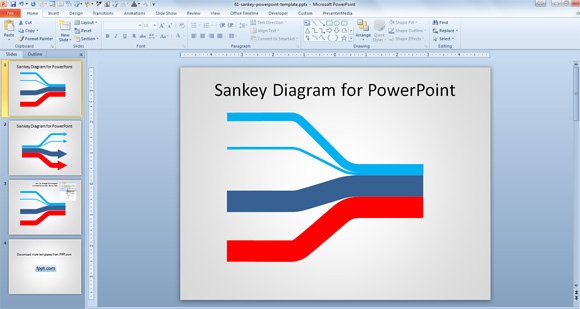
Time ago we have published a free template and article explaining how to make a Sankey Diagram. Today we have improved the way to create Grossmann diagrams in PowerPoint without requiring any other 3rd party software and just using PowerPoint shapes and lines. Using this free Sankey Diagram template for PowerPoint you can create your own Sankey Diagrams using Microsoft PowerPoint.

Accordingly to Sankey-Diagrams.com, a Sankey Diagram says more than 1000 pie charts, they have published lo of different examples on Sankey diagrams that you can use to get some inspiration. You can combine different Sankey Diagrams even with other visualization tools to get hierarchical or tree Sankey Diagrams as well as 3D Sankey Diagrams, horizontal Sankey Diagrams, Vertical Sankey Diagrams or other variants.
The easiest way we found to create this kind of Sankey PowerPoint Diagrams (widely used in thermodynamics but also in other fields, for example to help visualize the energy accounts or material flow accounts on a regional or national level) is by using one of the powerful tools in Microsoft PowerPoint, the shapes and lines.
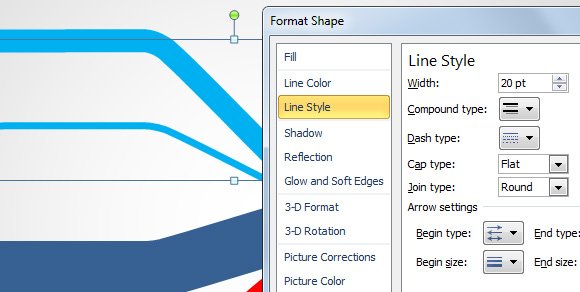
By changing the line width we can adjust the width of the Sankey Diagram, and you can easily add more flows to the diagram by copying and pasting the lines multiple times and then adjusting the position.

You can adjust the position by enlarging the height of the shape.

Also, if you need to prepare a Sankey Diagram with arrows then you can add arrows to the line by changing the shape line properties.

Finally, here is the template that you can download to make easier the job of adjusting and creating a Sankey Diagram for PowerPoint presentations.
Sankey Diagram PowerPoint (15363 downloads )