Creating a Business Intelligence PowerPoint template
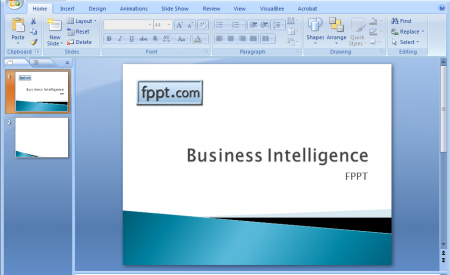
This article will help you creating a Business Intelligence PowerPoint template that we can use as a PowerPoint sample. This template can be reused later in order to accomplish your presentation needs at company or business presentations. For example if you are in charge of a Business Intelligence department you’ll be able to reuse the template for your future PowerPoint presentations.
In order to create a PowerPoint we first need to take a few minutes to think what we’d need to achieve. For example, by creating a business intelligence PowerPoint template we are assuming that we’d like to show dashboards and aggregated information in the PowerPoint slide. Then we can show this information and share the data and outcome with the company manager or other customers as well as internal employees. You can create PowerPoint template slides with conclusions and BI analysis.
The first step while creating a PowerPoint template could be to save an empty template in .potx file format. This file type is available in PowerPoint 2007 and PowerPoint 2010.

In a later stage, if you have advanced skills in PowerPoint then you can also add some kind of PowerPoint automation. PowerPoint automation will help you to gather the data from other sources if you are continuously updating PowerPoints. Process automation in PowerPoint can help you to save time and money extracting the data from a data source and automatically putting the data in the PowerPoint slide, ready for your presentation. By using process automation in PowerPoint you can get the data from reports or Excel spreadsheets and show the information to the end user.
Also, creating dashboards in PowerPoint are really helpful for any corporation or business intelligence unit. Dashboards in PowerPoint are easy to share with the participants in an online Meeting. You can share dashboard presentations in PowerPoint with other participants including employees and clients.
If you already are using a Business Intelligence software then you may take a look to see if the software already support exporting to PowerPoint. That will help you in the process to export the data to PowerPoint and may be you can automate the process at certain point.
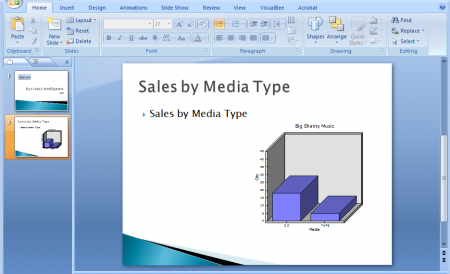
There are some other Business Intelligence Tools that you can use to get the data from reports and prepare the information into Dashboards or Summary Views. Then you can easily export charts to PowerPoint by copying and pasting.
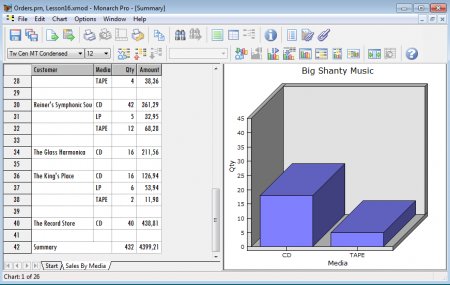
In this example, we got the data from Datawatch Monarch Pro and exported the chart into a PowerPoint presentation. Monarch Pro is a business intelligence tool that can help you extracting data from legacy reports or databases. It is focused on end-user so you don’t need to have programming skills or contact your IT for custom reports. For example, you can build attractive executive dashboards for PowerPoint.

Once we got the chart in the Summary view, we just copy & paste the chart into the PowerPoint slide. We can do the same with other output in our BI software or Excel spreadsheet and then create amazing business intelligence PowerPoint presentations.


One comment on “Creating a Business Intelligence PowerPoint template”