Advertisement
How to Change Margins in Google Docs and Google Slides
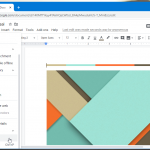
Many people upload their Word documents to Google Docs or their PowerPoint presentations to Google Slides. Since the capability of both these web apps has greatly increase over the years, many people now also use them for presenting documents and slides via large digital screens and projectors. However, switching to the big screen can result …