Tutorials & Tips

Chart Analysis Tools in PowerPoint

Chart analysis is good to use in mainly showing the distance between high and low points as well as making predictions on increasing and decreasing values over a period. In this tutorial we’ll explore what the Analysis Tools in PowerPoint’s Chart Tools section does. To start you will need a 2D bar or line chart. …

How To Make A Flowchart In Excel

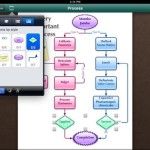
If you often require showing a task or process in a chart, then you would know the importance of flowcharts all too well. In previous posts, w explained How to Make a Flowchart in PowerPoint and also presented a comprehensive guide regarding the meaning of different flowchart symbols. This time we will show you how …

How to Make an Editable Doughnut Chart in PowerPoint

A doughnut chart displays value data as percentages of the whole and is a chart format available for use in Microsoft PowerPoint. Individual slices represent categories. Doughnut charts are functionally identical to pie charts because you can display almost the same data. There are two types of doughnut charts: doughnut and exploded doughnut. The basic way …

How to Play a PowerPoint Slideshow in a Small Window instead of Full Screen

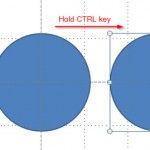
PowerPoint was originally intended for the purpose of presenting slideshows in a projector. However, over time, the software has evolved and is now being utilized for a range of other purposes. For example, PowerPoint is now commonly used for presenting online webinars or training employees remotely using software such as TeamViewer, GoView, or GoToMeeting. Additionally, …