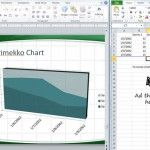
Charts

How to Make a Quad Chart in PowerPoint

Quad charts are a highly effective tool for presenting complex information in a visually appealing and easily digestible format. These charts divide data into four distinct quadrants, allowing you to convey multiple ideas or datasets in a single slide. Used across various industries, from business and marketing to research and education, quad charts can help …

How to Make a Development Diamond Diagram in PowerPoint

In PowerPoint you can make a development diamond PowerPoint template by using the PowerPoint radar chart. This kind of diagrams is used for example to compare countries GNP or GDP per capita. You can use this approach to assess the level of development in a given country. But higher per capita income in a country does …

Marimekko Charts PowerPoint

Marimekko Charts are widely used in finance projects, economy and also in MBA courses like in Harvard Business School. Marimekko charts are also widely adopted in Marketing for example to analyze customer segmentation and market segmentation. Here we will show you how to build a Marimekko Chart in PowerPoint. Once you have chosen the chart type, you need …