PowerPoint Presentations

Thermometer in PowerPoint 2010

A thermometer can be a great visualization tool to be used in conjunction with gauges and other dashboard elements. However, PowerPoint by default do not include this visualization in the SmartArt Gallery or in the available charts. Here we will show you how to make a simple thermometer in PowerPoint 2010 using Shapes. This thermometer …

Make Interactive Maps with StatSilk Software
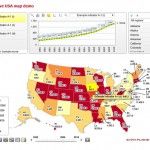
Creating Interactive Maps and impressive visualizations for presentations is something that many presenters may wonder how-to in order to impress the audience. Fortunately we can now access to StatSilk. StatSilk offers a range of web-based and desktop software to cater to diverse mapping and visualization needs including interactive maps and other data visualizations. By using StatSilk software …

Teachers can get feedback from Students using Understoodit: Confused or Not?

Understoodit is a tool that educators and students can use to make sure that students understand what the teacher is presenting. This can be very helpful as a feedback for educational organizations like Universities and colleges but also for individual teachers that want to learn more about their students. Students anonymously indicate whether they understand …

PowerPoint to XML

XML is a format used to store data that can contain not only text but also binary information or media like images, audio, video. It uses a structured format and nowadays it is widely adopted in many different sectors to exchange data between computers and as a file format that is easily versionable. Recent versions …