Advertisement
The One Million Tweet Map: Using Maptimize to Visualize Tweets in a World Map
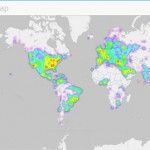
The one million tweet map is an interesting social media tool that you can use to visualize tweets and aggregated Twitter data in a world map. By using The one million tweet map you can run searches specifying a search term or a hashtag and quickly find a heatmap. The One Million Tweet Map is the name that …