Cashflow Analysis Excel Template

Excel 2016 allows users to use, analyze, and visualize different kinds of data from different sources. If you’re in business and you want to keep track of your financial health, then you would benefit a lot from this new Excel 2016 template. The Cashflow Analysis Excel Template is a simple but fantastic template that you can use to analyze, report, visualize, and present your cashflow data in interesting ways.
It allows you better insight into your business’ cashflow, while at the same time allowing you to maximize the data analysis functions of Excel 2016.

Display Cashflow Data and Trends
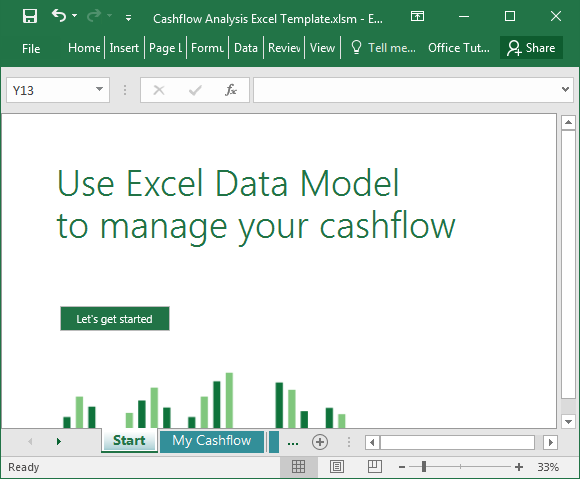
To start your Cashflow Analysis Excel Template, you can just create a new worksheet as you would in previous Excel versions. Just click on New and look at the My Cashflow template among the many other Excel template that populates under the option. It also appears as a “business analysis feature tour.” Open this template and click on “Let’s get started” in the Start worksheet tab.
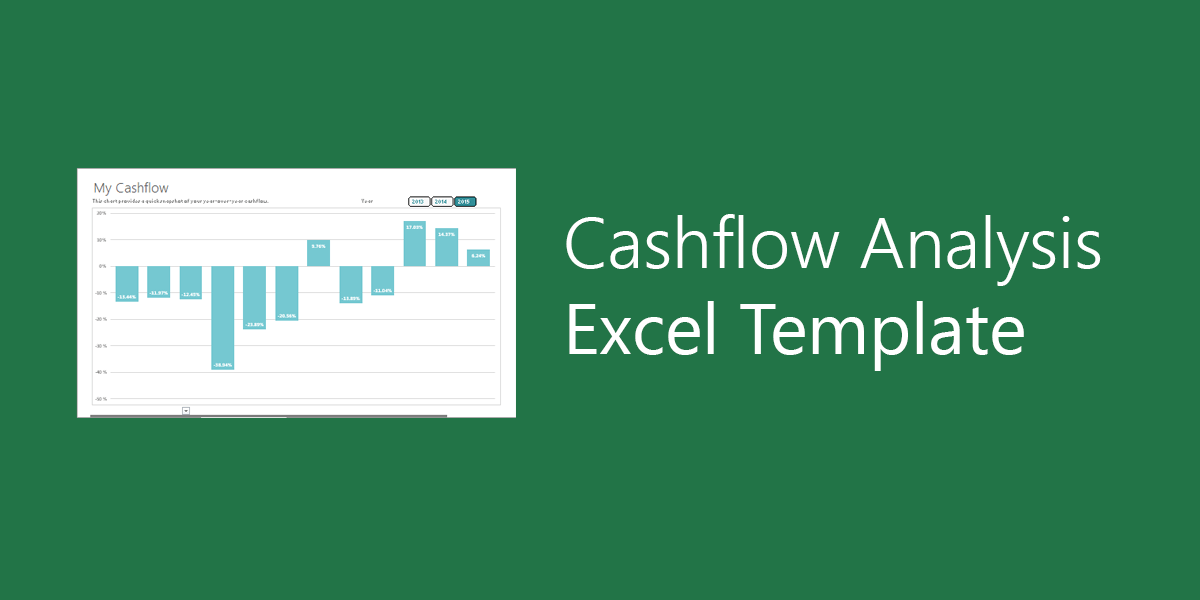
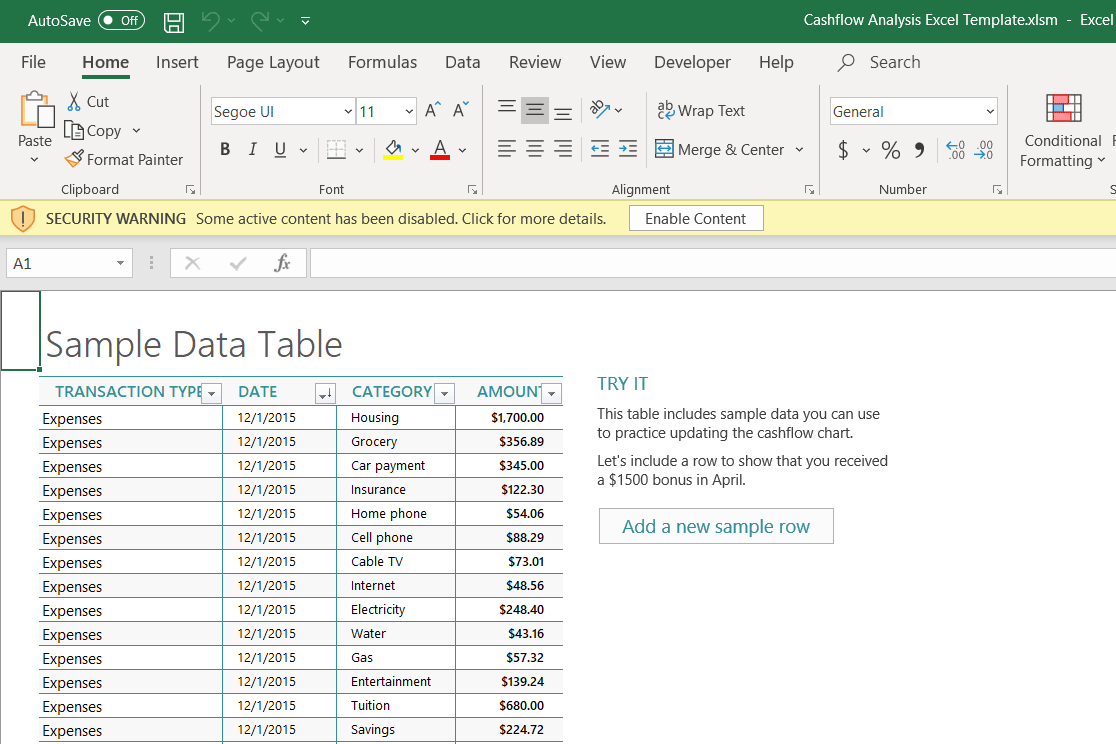
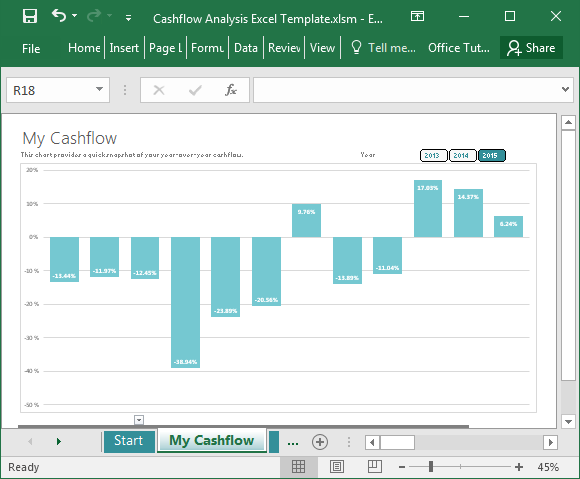
You can also click on the My Cashflow workbook tab to show the cashflow report of your business or organization for any given year in the template. You can display year-on-year cashflow comparisons, which is great for analysing trends and forecasting your future cashflow. Of course, what you will see at first is sample data, and you can create your own cash flow data by typing in your own numbers. Just follow the given columns, which are Transaction Type, Date, Category, and Amount.

Beautifully Designed Template for Reports and Presentations
Once you have entered your own data, you can now go back to your chart and click on “Update now” to populate your updated information.

This cashflow template allows you to create easy and simple data analysis for your business. You can also use this to create more complex collections of data, as you would a database.
Need Help with your Excel spreadsheets? Get Microsoft Excel tasks done-for-you.
Visit Excel Rescue