Calculate Mileage And Fuel Expenses With Vehicle Log Book For Excel
Whether or not the economy is undergoing difficult times, it is still important to find ways to save money and resources in any activity you get into. For example, you can save on fuel by taking public transportation instead, or getting into carpools. You can also save a lot on fuel by planning your trip ahead of time and seeing the best route or you to take to reach your destination.

You can calculate mileage and fuel expenses with the Vehicle Log Book for Excel. This Vehicle Log Book for Excel is one of the many Excel templates that you can use for just about any aspect of your home and business. This Vehicle Log Book for Excel in particular can help you calculate the various expenses that are part of owning a vehicle.
This template is perfect for vehicle owners, whether for personal or business use. You can create a collection of vehicle log books to help you with your vehicle rental or vehicle dealership business. This template can help you keep track of your budget for your vehicle, especially in terms of maintenance and fuel costs.

This Excel template can help you compute for your vehicle’s Total Mileage, Total Gas Cost, Average MPG, Total Maintenance Cost, Total Gallons of Gas, Total Loan Payments. This template can conveniently augment any budget template that you have because this is specifically designed for your vehicle expenses to see how much of your total vehicle budget is divided into Loan, Gas and Maintenance Costs.
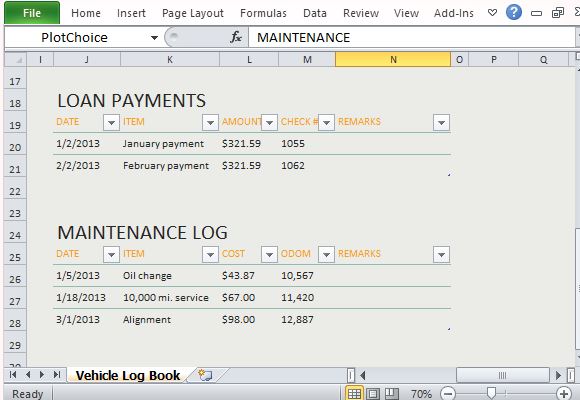
With this template, you can also log you Odometer records as well. In the Gas Log, you can record the date and the corresponding odometer readings for previous and current, and the range, as well as the gallons of gas you have spent that day. This function can be used for both old or brand new vehicles. Aside from this, you can also log your Loan Payments and Maintenance Log in different specifically designed tables. Just fill in the tables with the dates, item, amount, check number and remarks.

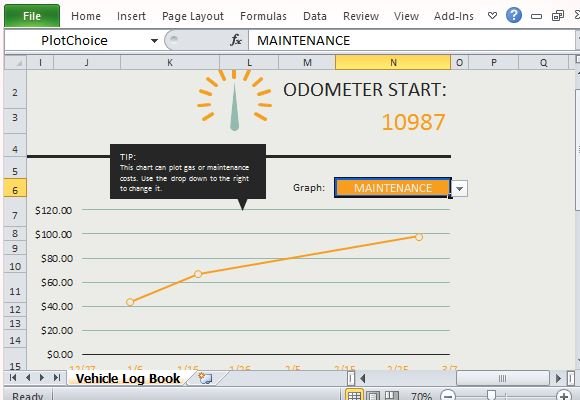
This template contains a Doughnut Chart to show you how much of your vehicle budget was spent on Loan, Gas and Maintenance. This template also contains graphs that allow you to view various data for your Maintenance and Gas. All you have to do is to click on the drop-down on the Graph header to change your data view.

I am curious what the actual mathematical equations are used to calculate the Doughnut chart?