Best Software & Services For Performing Cohort Analysis
Last updated on December 27th, 2024
Cohort analysis is becoming an essential form of data analysis for a variety of industries and sectors, including e-commerce platforms. There are a number of Cohort Analysis tools which can enable you to perform a cohort analysis effectively. Data derived after performing a cohort analysis can be particularly useful for formulating new business & marketing strategies and you can also have something special to show with your next PowerPoint presentation before your senior management.
What is Cohort Analysis?
Cohort analysis is performed using e-commerce platforms such as web and mobile applications and even online games. A cohort analysis is performed by breaking down data in related groups with common characteristics.
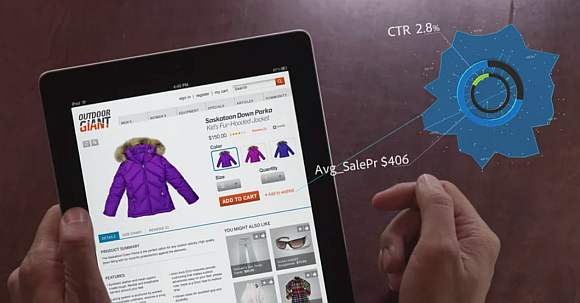
A cohort analysis can be quite useful for organizations to analyze user lifecycles and to see what segment of customers might be most responsive to their product or service. Such information can help companies tailor their products and services to cater for a budding market segment.
It is worth mentioning here that cohort analysis is a term tied to big data and business analytics, whereas ‘cohort study’ is a more general term which encompasses analysis of data performed according to groups.
You can learn more about cohort analysis from our post about: How to Make a Cohort Analysis Chart in PowerPoint.
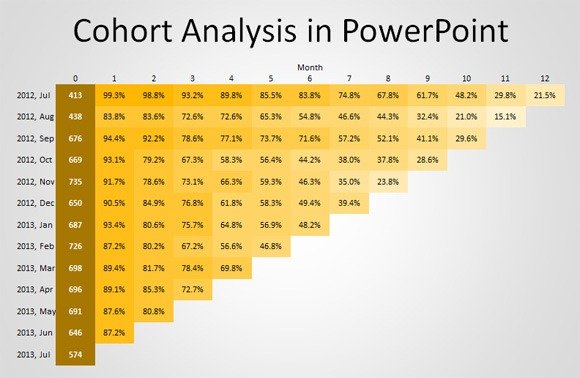
Best Tools for Performing Cohort Analysis
There are a number of handy platforms which can be used for performing a cohort analysis. We have compiled a list of a few of the best software and services for performing cohort analysis to help you analyze your big data in a meaningful manner. These apps provide a range of filters, digging through many layers of information to allow you to analyze your data and make use of the haystack of big data that might already be lying idle on your servers. Using these recommended services you can also generate charts to present in presentations and official reports.
Adobe Analytics
When it comes to performing a cohort analysis where you can dig several layers deep into your data to identify your clientele to the micro level, few tools match the ability provided by Adobe Analytics. With advanced segmentation, predictive marketing and real-time web analytics, Adobe Analytics serves as a perfect solution for discovering high-value customers for maximizing profitability.

Adobe Analytics is a part of the Adobe Marketing Cloud, which also comes with a range of other useful tools like Adobe Target, Adobe Social, Adobe Experience Manager, Adobe Media Optimizer, Adobe Campaign and Adobe Audience Manager. These marketing intelligence tools can help you in running your various marketing campaigns and also to identify KPIs (Key Performance Indicators).
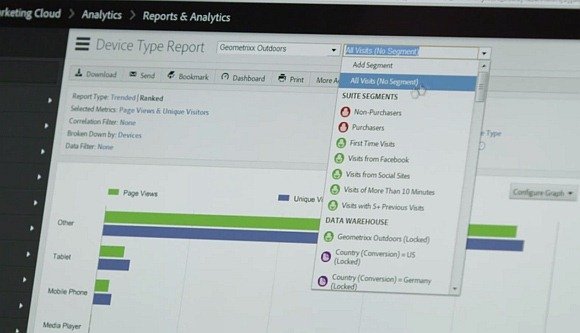
You can find out more about Adobe Analytics and other products from the Adobe Marketing Cloud family from the link below. Also see this introductory video (below) for Adobe Analytics.
Go to Adobe Analytics
Google Analytics
If you have ever used Google Analytics, you might have noticed the plethora of options available for analyzing traffic. Google Analytics is a perfect example of cohort analysis, as it enables you to dig deep into your audience by analyzing even small aspects like the browser type and operating system used by people visiting your website.
There is even a new Beta version available which allows you to generate cohort charts from your data.
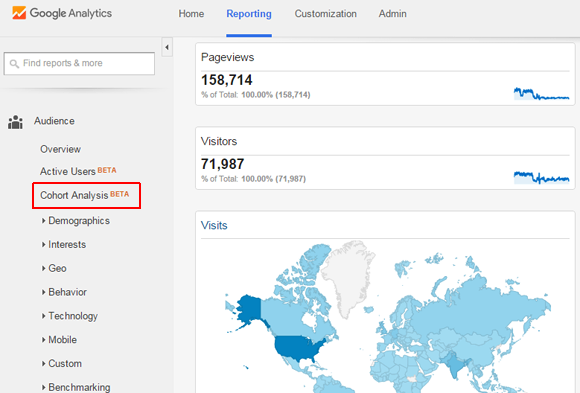
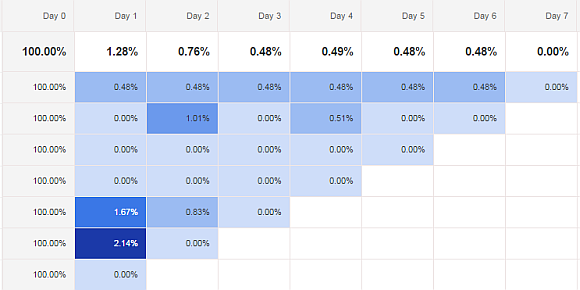
The below screenshot shows a cohort chart generated using data from Google Analytics. You can also run campaigns, analyze your data using custom filters and set alerts when a certain threshold is reached, (e.g. a certain number of monthly visitors).
Go to Google Analytics
Mixpanel
Mixpanel is a service which tracks business analytical with mobile and web apps. It comes with A/B tests and survey forms for checking user responsiveness. The data collected via Mixpanel can be used for generating detailed reports to measure user engagement. Mixpanel is particularly useful for SaaS based solutions.
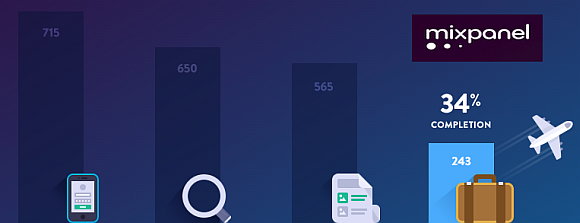
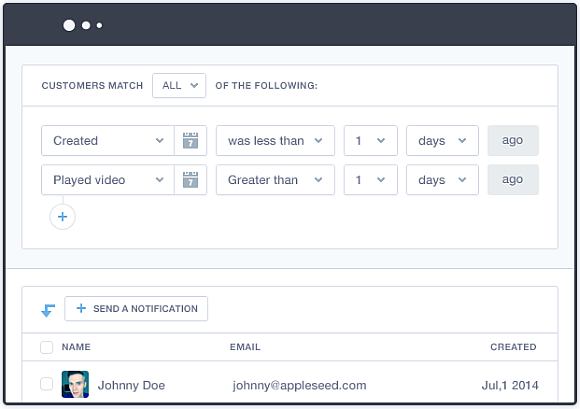
Data collected via Mixpanel can not only be useful for retaining new customers or targeting an increasing market segment but also to re-engage old customers. Activity Feeds in Mixpanel allow viewing what users do before and after using your app. This can help analyze patterns that may bring value for end users.
Go to Mixpanel
Rjmetrics
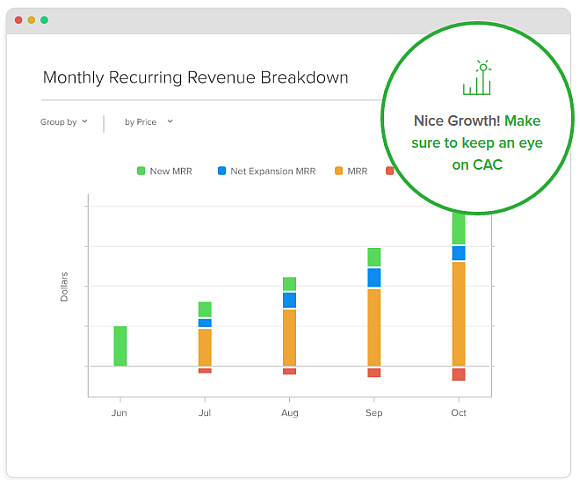
Rjmetrics is a service which provides hosted business analytics solutions. It has two major products, namely; Pipeline and CloudBI. The former connects to various sources of data and keeps track of the health of your data. CloudBI is a business intelligence solution which provides detailed analysis features for your data.
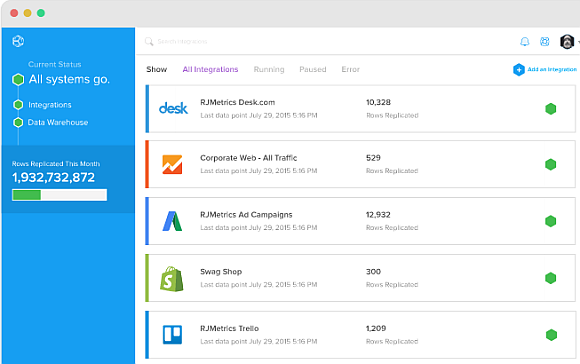
Rjmetrics can be used with data sources from MYSQL, SQL Server,Oracle, heroku, PostgreSQL, mongoDB and a range of SaaS powered sources such as Google Analytics, Google AdWords, Salesforce, Zendesk, etc.
Go to Rjmetrics
