Best Websites to Make Infographics
Last updated on March 5th, 2024
Complex data, trends and analysis can be quite difficult to explain to an audience in raw form. Many presenters and analysts try to represent such information using tables and charts, however, looking at data in statistical form with a few legends and headings isn’t all that easy to soak in for an audience. This is why the use of infographics can be a blessing for anyone who requires presenting data and trends in an easy to understand format.
What is an Infographic?
An infographic is a graphic which presents information in visual form. Infographics can include general information, knowledge related to a specific subject and even statistical data in a graphical format, which is often easier to understand than conventional charts and tables. This is because when designing an infographic one can make use of images, diagrams, maps and a range of other visual tools to make it as easy understand as possible.
An infographic doesn’t always have to be data driven, as it might even include knowledge tied to a specific topic. For example, if you are a biology teacher you can create an infograph for your students to help them understand concepts like the food chain, biodiversity, ecosystem and the like.
Infographs are not only a good way of disseminating information but you can also use them to create awareness about an issue. There are various hot topics which are often represented in the form of infographics, such as global warming, poverty, gender equality, etc. The ability to visually understand a concept using graphics can be often easier than seeing mere numbers.
Even if the statistics are too crowded, a viewer is more likely to understand the gist of the subject by viewing a graphic which gives a fair idea about the impact or relevance of a subject than merely viewing numbers flashing on the screen. Moreover, one can make use of images that the viewer can relate to. This can help an audience quickly grasp a concept or idea. This is what makes infographics so much more powerful than conventional forms of information sharing.
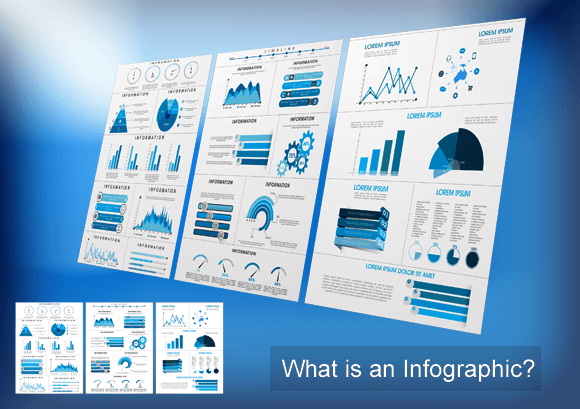
Best Infographic Maker Tools & Best Websites to Make Infographics Online (with Templates)
Lately, a number of tools have made it quite easy to generate infographics. These infographic maker tools include web apps and Office Templates that can help you create your own infographics, without having to use complex applications like PhotoShop. Furthermore, these tools and templates are usable by people who have no knowledge of graphic designing. We have compiled a list of a few platforms which offer infographic templates and tools to help you convert information into a visual infograph.
1. Piktochart
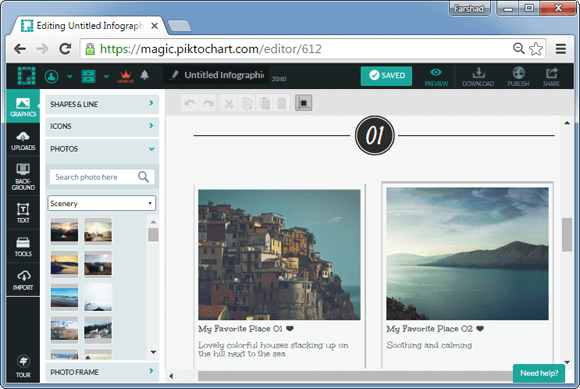
When it comes to easy to use infographic makers, Piktochart is clearly one of the top choices. With more than 500 templates, Piktochart makes it extremely easy to create infographics, presentations, posters and reports. You can start off by picking a template and edit it using the feature rich editor at your disposal.
Piktochart gives a complete library of shapes, lines, icons, free photos and frames that you can use for creating your own infographics. You can use this web app for free and optionally upgrade for more robust features and templates. Using Piktochart you can share your infographics online or download them offline in PNG and JPEG image formats.
2. Infogr.am
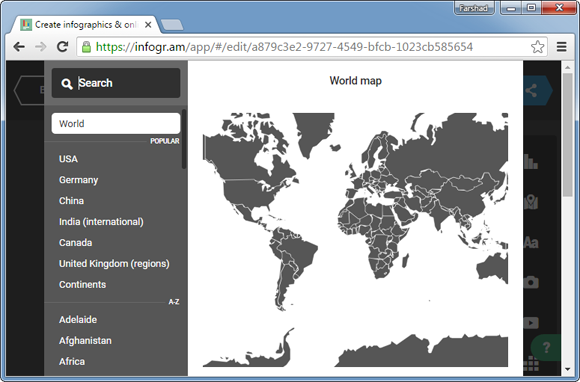
Infogr.am is another great website for making amazing infographics for free. This is a web app which has been specifically designed to help users create infographics. You can generate infographics with charts, maps, tables, etc. There are various templates you can choose by category and even opt for importing files via OneDrive, Dropbox and Google Drive.
Even the free Basic account is adequate enough for making good visualizations which can be used in your PowerPoint presentations, blog posts or professional projects. However, the free Basic edition is limited to 10 infographics, with no downloads.
3. SlideModel
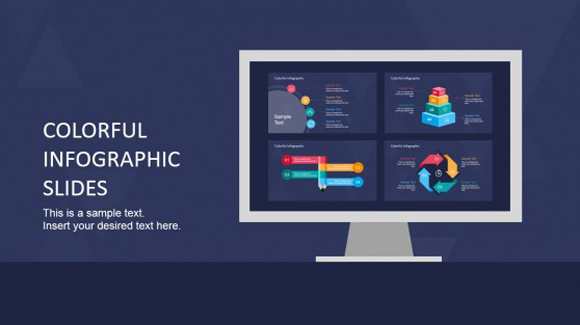
A very easy method of making infographics, especially for presentations is to use infographic templates. SlideModel is one of the most impressive websites for downloading infographic templates. The good thing about SlideModel’s templates is that they come with layouts that you can comprehensively customize. For example, you can drag and drop to move objects or change the color of slide elements. The infographic collection of PowerPoint Templates at SlideModel give a range of handy layouts with maps, charts, illustrations, animations and generic infographic layouts which can be used with your specific topic by adding text to populate sample slides.
If you are looking for easy to manipulate infographic templates for PowerPoint that are both high-quality and easy to customize, then SlideModel is worth checking out.
4. Canva
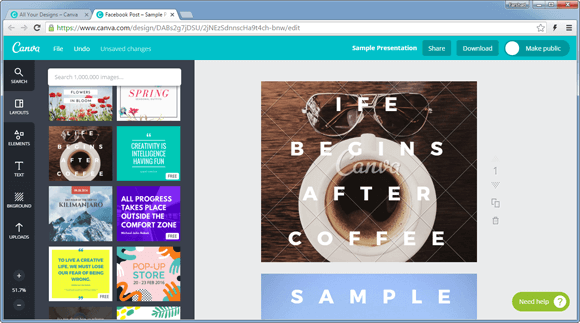
Canva can be used as a tool for making infographics as well. Canva provides a plethora of categories to choose infographic templates. You can create anything from presentations to social media graphics, posters, blog graphics, infographics and more.
Canva has an easy enough mechanism for making visual content. Just pick a template according to the type of graphic you intend to make and you can easily edit it using a range of editing features, which also includes a built-in image editor. Furthermore, you can upload your own images, make use of royalty free images provided by Canva (free and premium images), backgrounds and elements. You can download your designs in image or PDF format or share them online. You can use Canva via browser or iPad app. There is also a WordPress plugin to integrate Canva with your blog.
It is worth pointing out that while you can create infographs and other types of graphics for free, downloading them requires a premium account. Canva is more suitable for people looking to create professional graphics, especially ones who might not be proficient at professional software like PhotoShop or CorelDraw.
5. Easel.ly
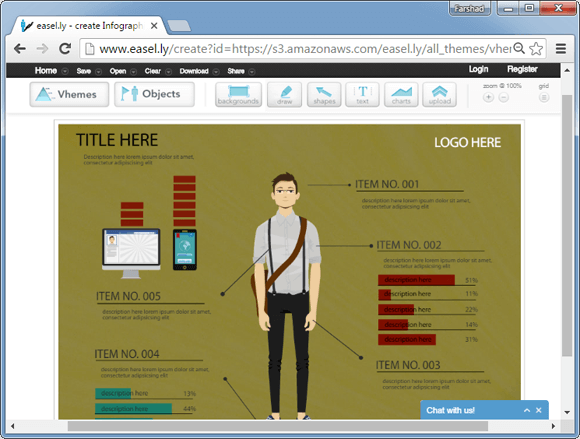
900,000 users and more than 2 million graphics should be a fair enough indicator about the utility of Easel.ly. With Easel.ly you can create infographics for free with the help of a plethora of infographic templates. The good thing about this web app is that it not only gives fully editable templates to help you create your infographs with ease but you can also download your graphics for free as a JPG image or PDF file.
Among the various useful editing features you get the option to add stylized text, shapes, objects, charts and the utility to upload your own images. Another great feature of Easel.ly is the option to directly ‘Present’ your infographics right from a browser.
6. Visme
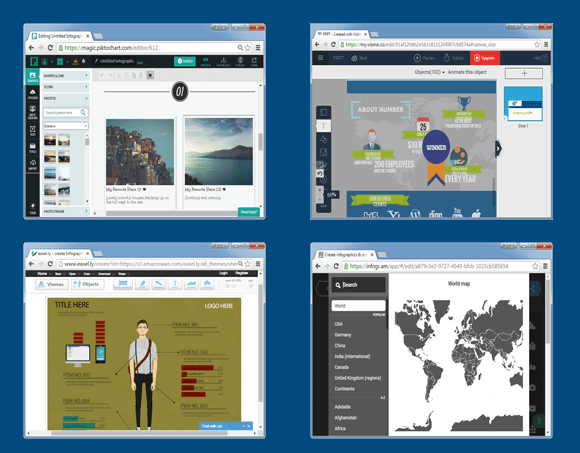
Visme is an HTML5 powered web app which gives templates and tools for making presentations and infographics. You can get started by using a readymade infographic template and edit the objects in the graphic to generate your own.
While Visme has many good features like Easel.ly, infogr.am and Piktochart, its free version is quite limited and one cannot do real work without upgrading to a paid account. Having said that Visme is a powerful infographic maker and the templates are good enough to make one consider an upgrade. You can try out Visme for free to see if it works for you before going pro.

We have reviewed some of the best websites to make infographics. If you need help preparing your next infographic, you can also read our article how to make an infographic in PowerPoint or the big list of alternatives to PowerPoint. While the article covers the creation of infographics in PowerPoint, similar techniques apply to make infographics in Google Slides.
