11+ Best Dashboard Templates for PowerPoint Presentations

PowerPoint dashboards serve as an effective method to display important bits of information in an easy-to-understand layout. Dashboard layouts are useful for displaying analytics, trends, target market, and maps. You can use these Dashboard Templates for PowerPoint to present your information with visually appealing slides, including infographics, timelines, roadmaps, business diagrams, and provide related information side by side to save space, make your presentations brief, and allow your audience to easily grasp related content. Here is a list of 10 Best Dashboard Templates for PowerPoint Presentations.
1. Metro Dashboard Design for PowerPoint
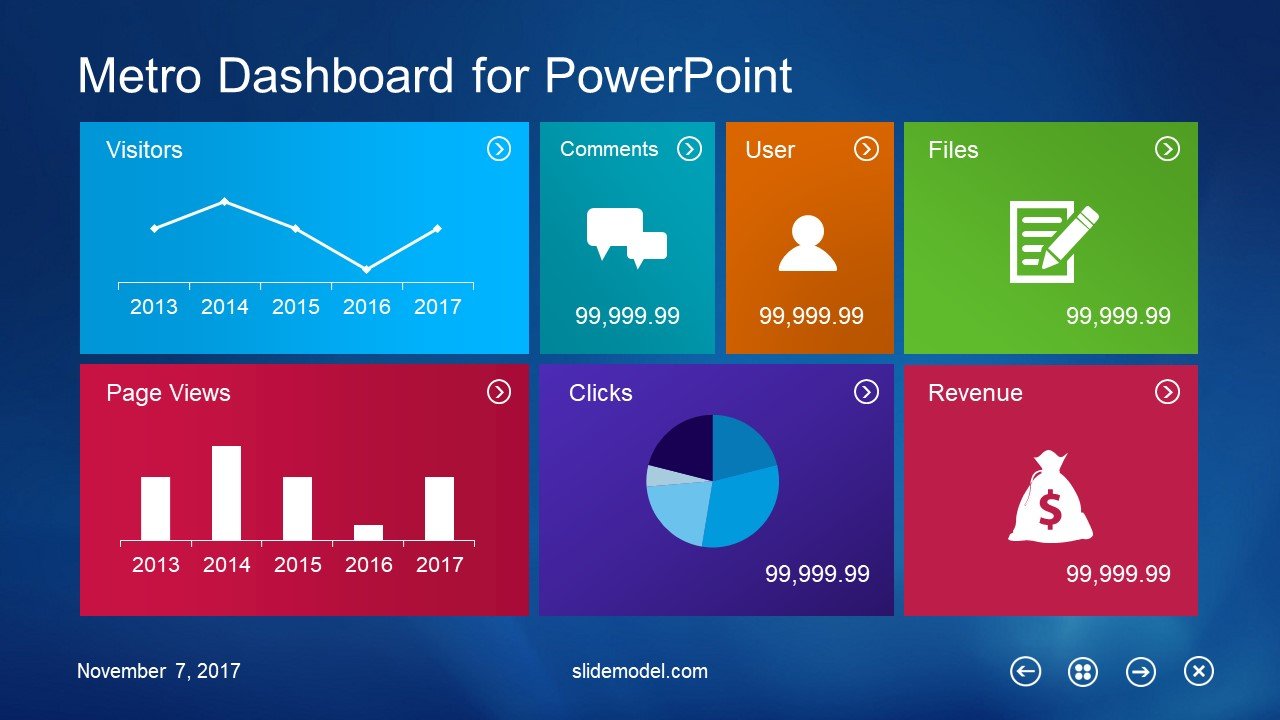
Inspired by the Metro UI of contemporary Windows operating systems, this template provides tiled layouts in PowerPoint & Google Slides to help you easily present all kinds of data using fewer slides. The sample slides are designed like Modern UI apps and you can fill in your information by editing or replacing the given tiles to design your slides with a look as cohesive as the Windows Start Screen.
2. Sales Manager Dashboard Template for PowerPoint
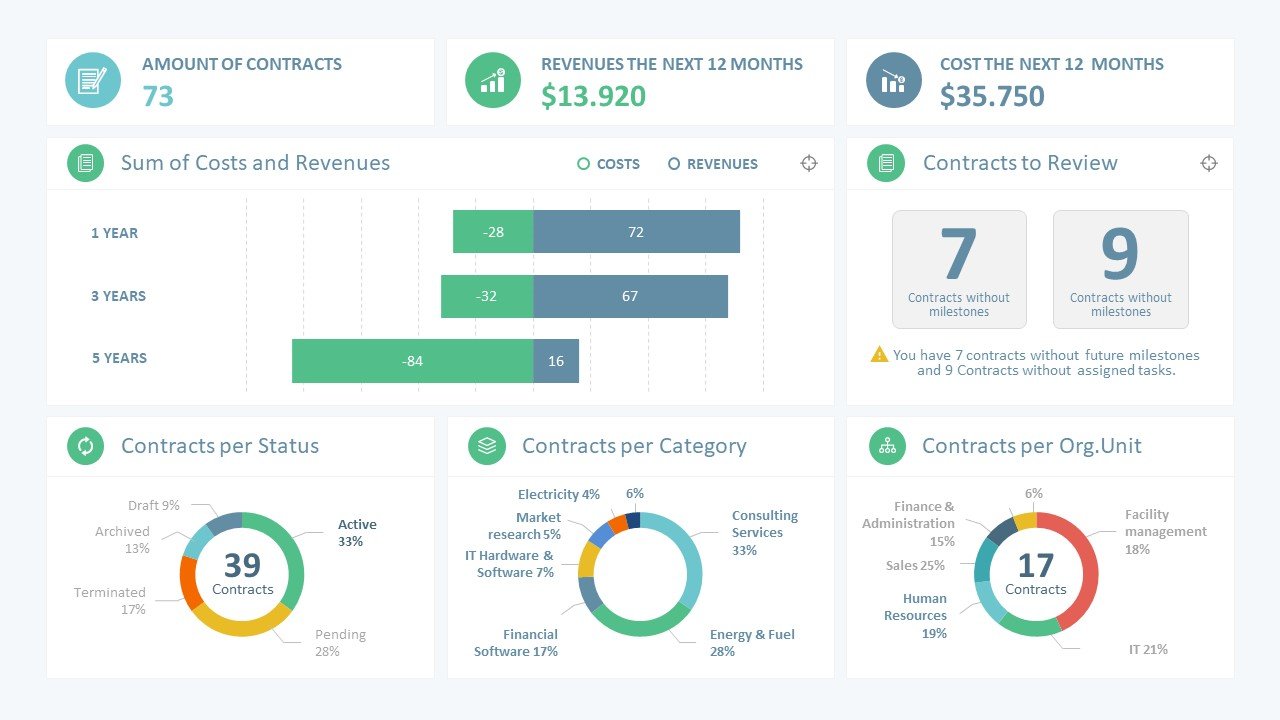
This is a sales driven dashboard template for PowerPoint. This template has slides for revealing revenue, cost, trends, cash flow diagrams and other types of financial information. You can use the given sample slides for revealing sales data, trends, information about an organization’s financial health, quarterly performance and the like. There is also an icons slide in the template with useful finance and sales related icons for designing your slides.
3. Single Slide PowerPoint Dashboard with Map
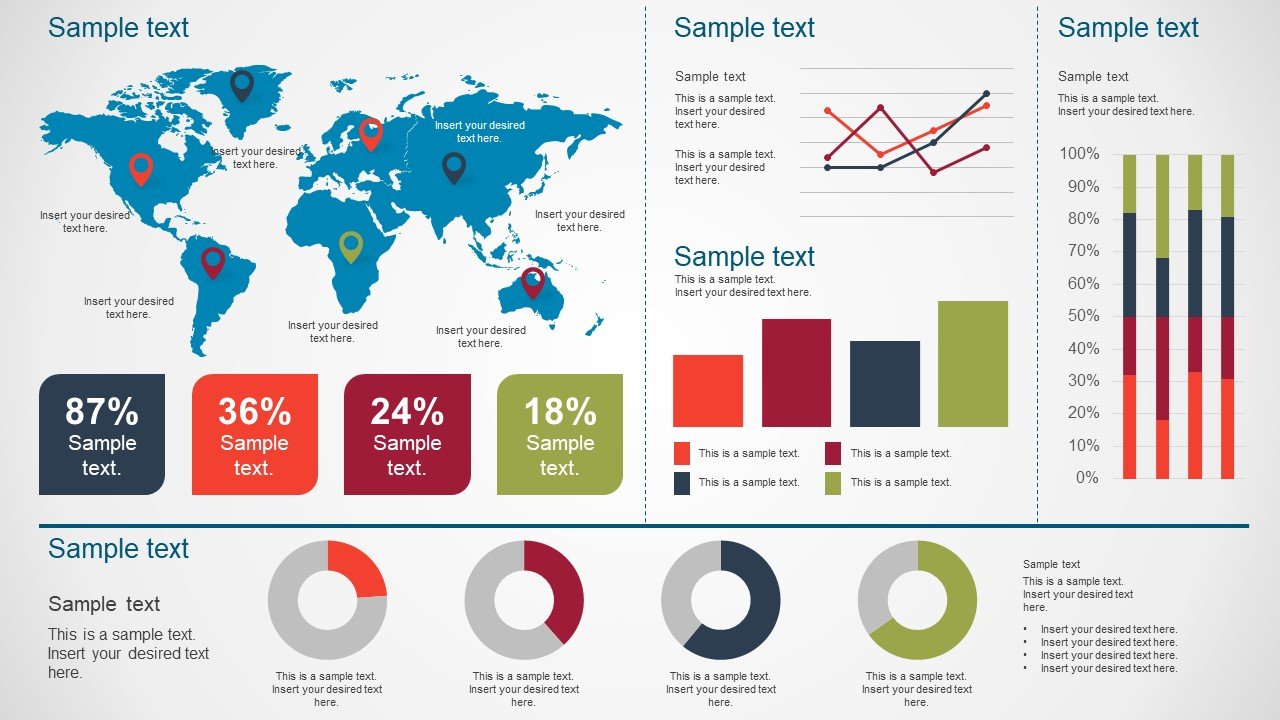
As the name implies, this is a single slide template with a world map and sample charts for designing your slides. This single slide template with a dashboard deisgn might be useful for discussing demographics, market segments, product outreach, financial forecasts, etc. You can use the one-pager dashboard template in PowerPoint & Google Slides presentations.
4. Scorecard Dashboard PowerPoint Template
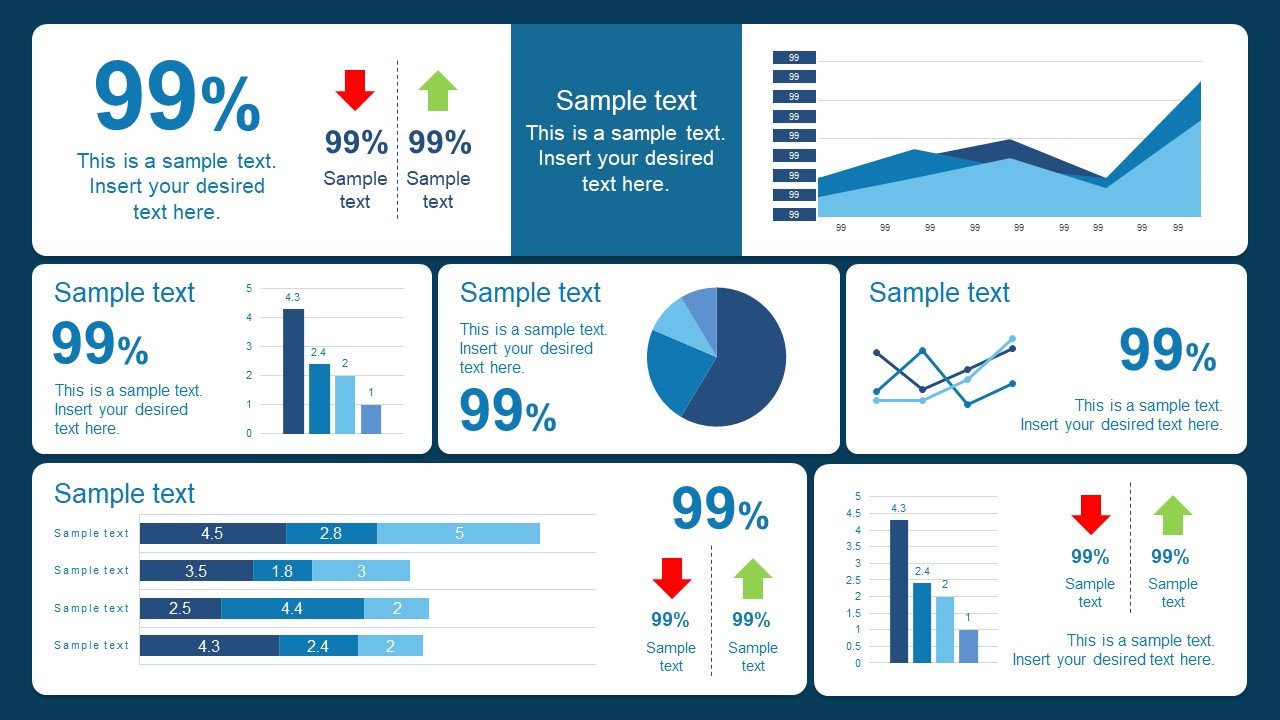
This data driven template can be used for presenting essential statistical information in the form of charts and for developing your own scorecard in the form of PowerPoint slides. If you’re looking for a simple dashboard template for PowerPoint for revealing data, trends and ratings, this is it.
5. Creative Dashboard PowerPoint Template
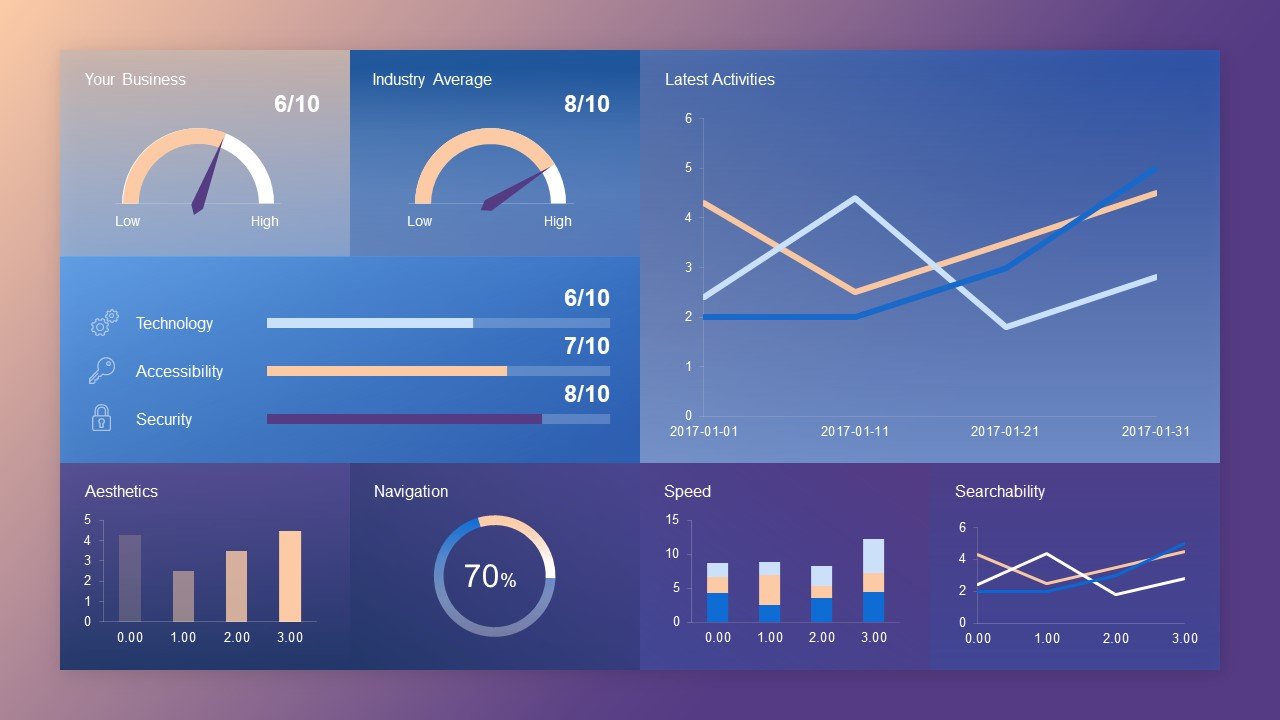
Want to get creative with your slides? Why not try a creative dashboard template for presentations? This is a rating based template which can be used for giving a score or rating. Furthermore, you can also use the template for discussing key performance indicators (KPIs), data and trends by editing the various charts and rating indicators (gauges).
6. Flat Sales Dashboard Template for Presentations
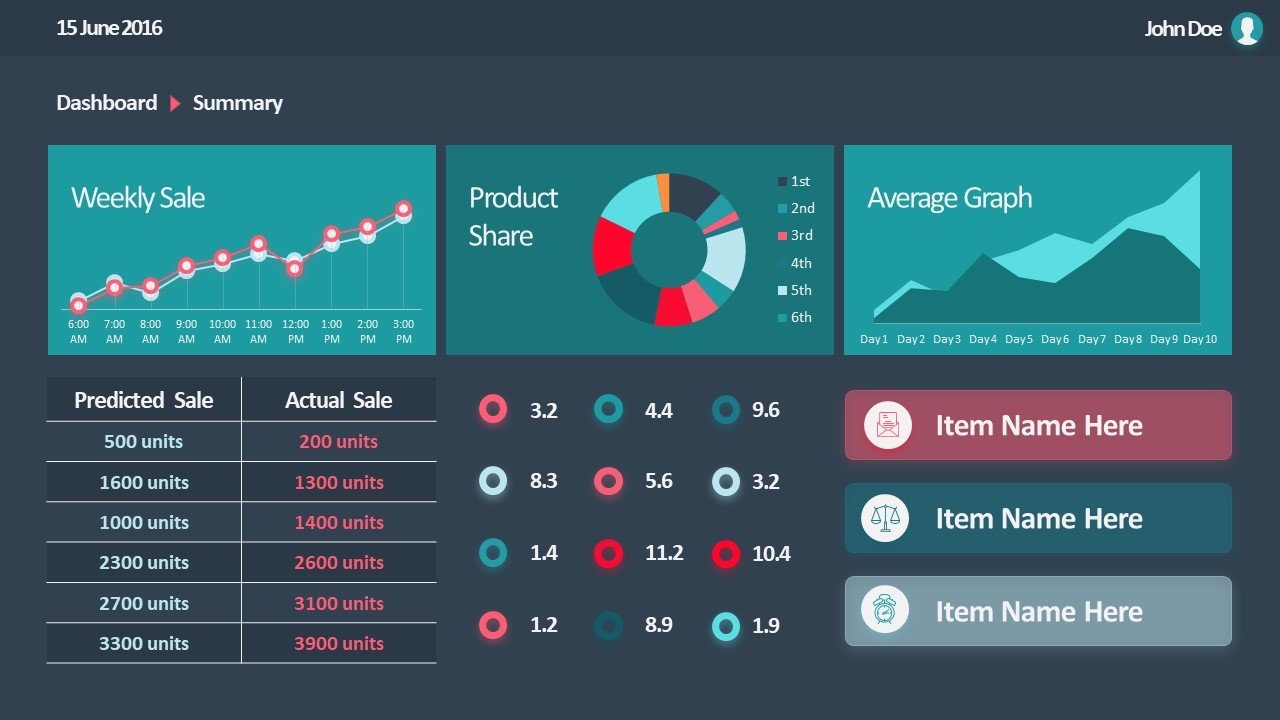
This is another sales-themed dashboard template for PowerPoint with slides that can help you reveal sales-related data and discuss forecasts and trends. The slides provide enough scope to discuss existing sales data and mention anticipated sales and financial projections.
7. Timeline Template Material Dashboard for PowerPoint
Timelines make up for an essential part of many presentations, as they provide an overview for past or future events. This timeline template can be used for making timelines and infographics in the form of PowerPoint dashboards.
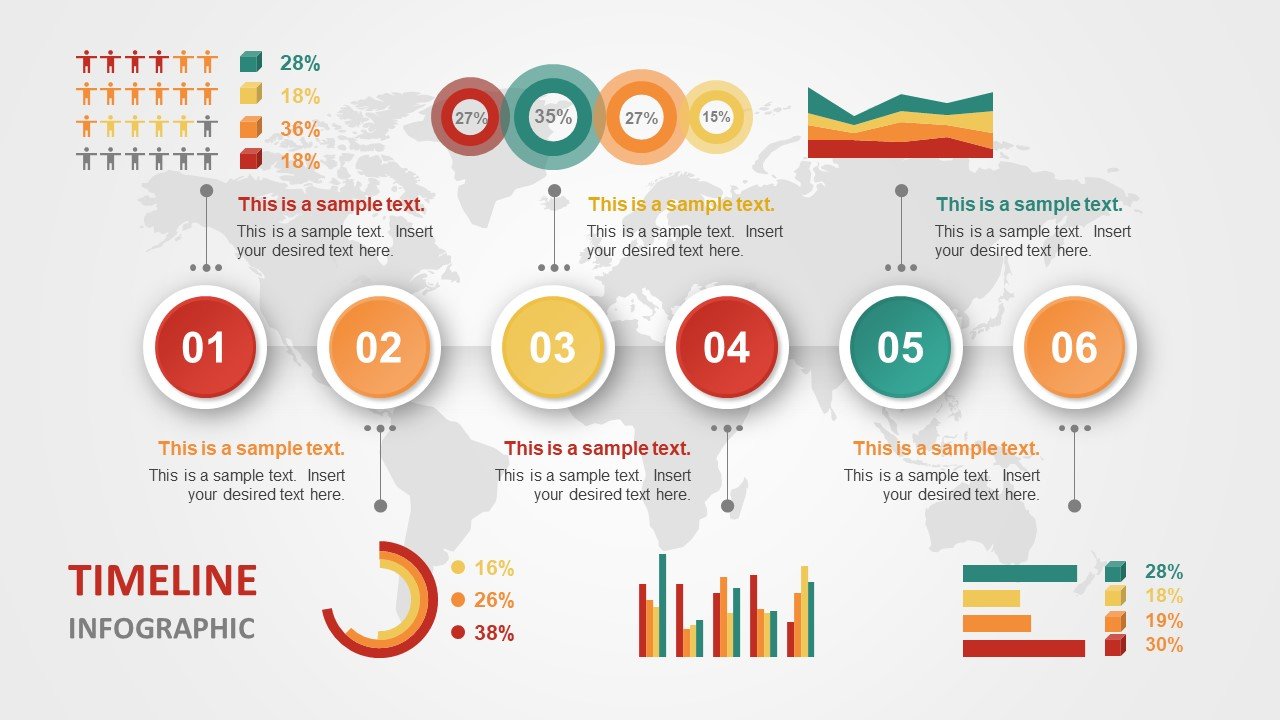
What’s interesting about this dashboard PPT template is that you can design slides that reveal the timeline as a slideshow in a precise order. As you proceed with your slides, you can highlight only one section of the timeline slide and make the rest less prominent. This can help you better focus on your specific part of the timeline as your present your content. Also, this dashboard template is 100% editable and compatible not only with PowerPoint but with Google Slides presentations as well.
8. Blur Dashboard PowerPoint Template
This is a simple dashboard template for PowerPoint & Google Slides with a single-slide dashboard design. The single dashboard provides small charts and diagrams with space for adding additional information as you deem fit.
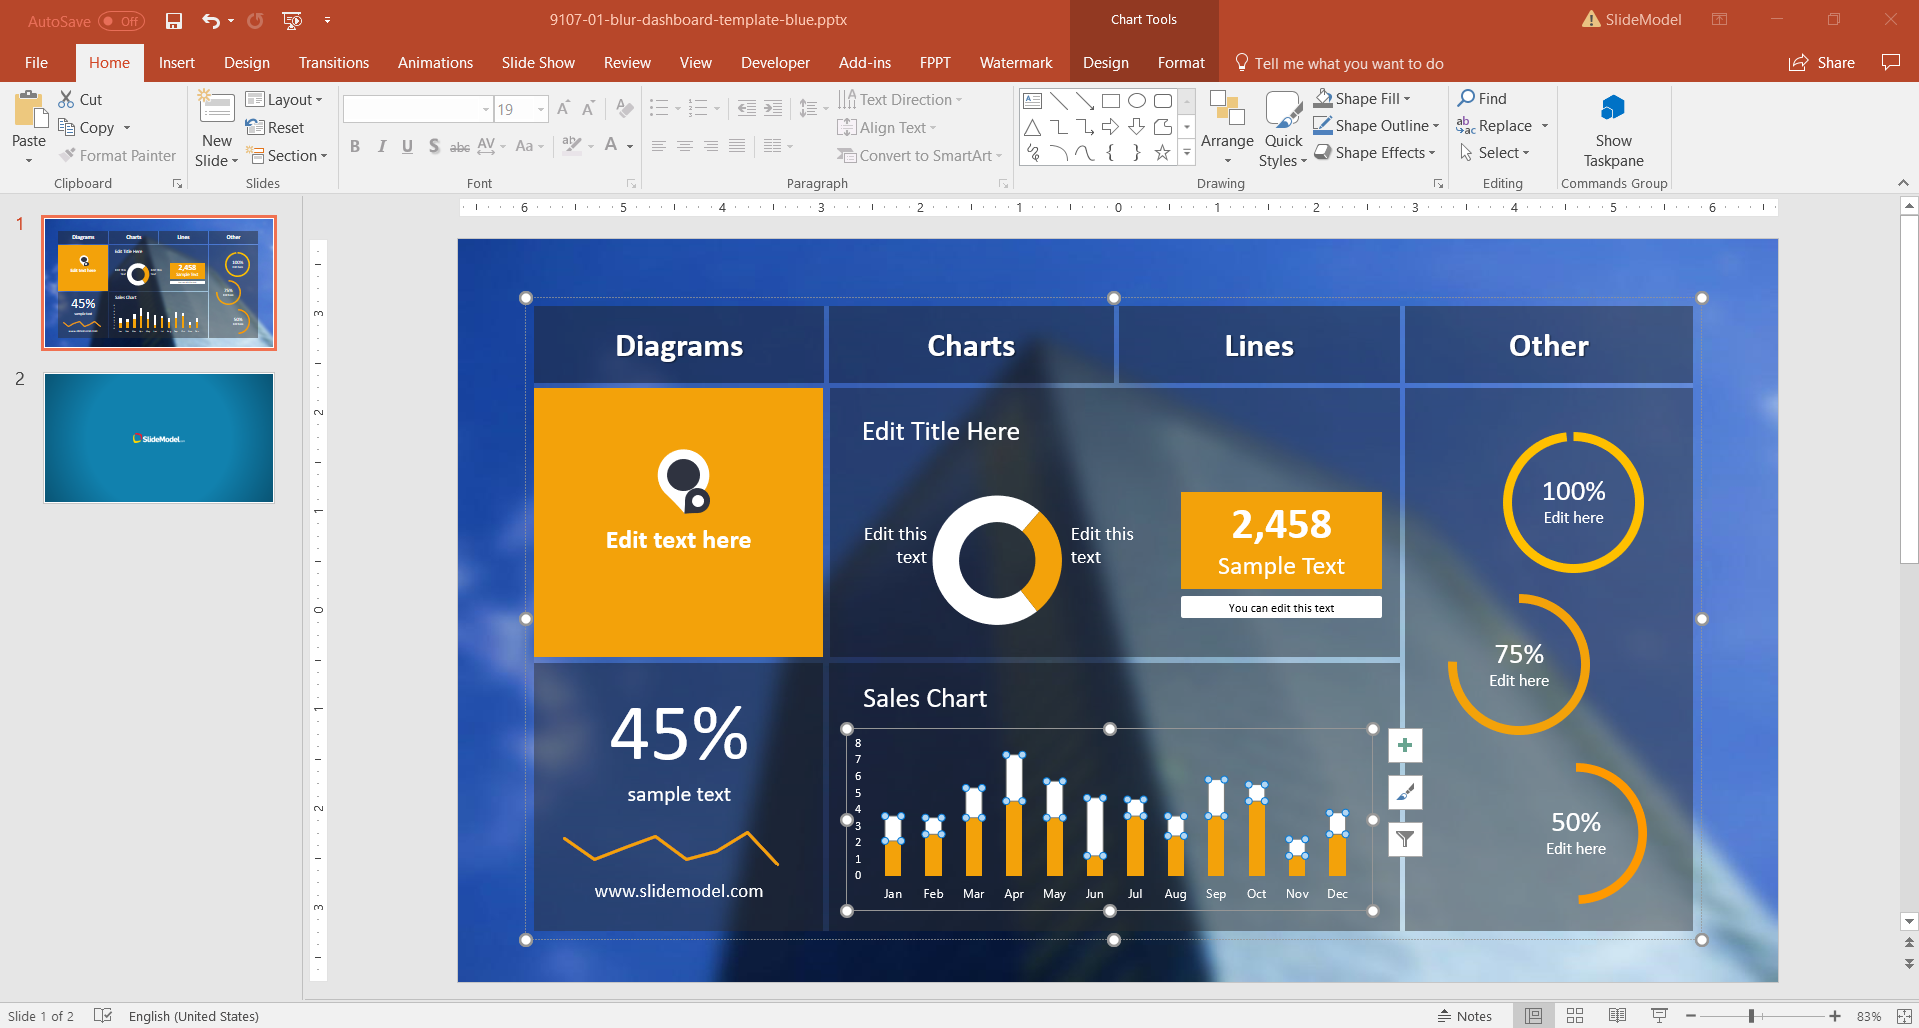
The blur design is quite visually pleasing amidst flat-colored diagrams and charts, making the dashboard easier for your audience to understand.
9. Financial Savings Infographics PowerPoint Template
Financial trends and savings need to be projected in a way that is simple enough for the audience to understand. A manager from the finance department of an organization might find it hard to present complex financial information before say, board members. This is why the use of relevant images, and icons can be quite helpful.
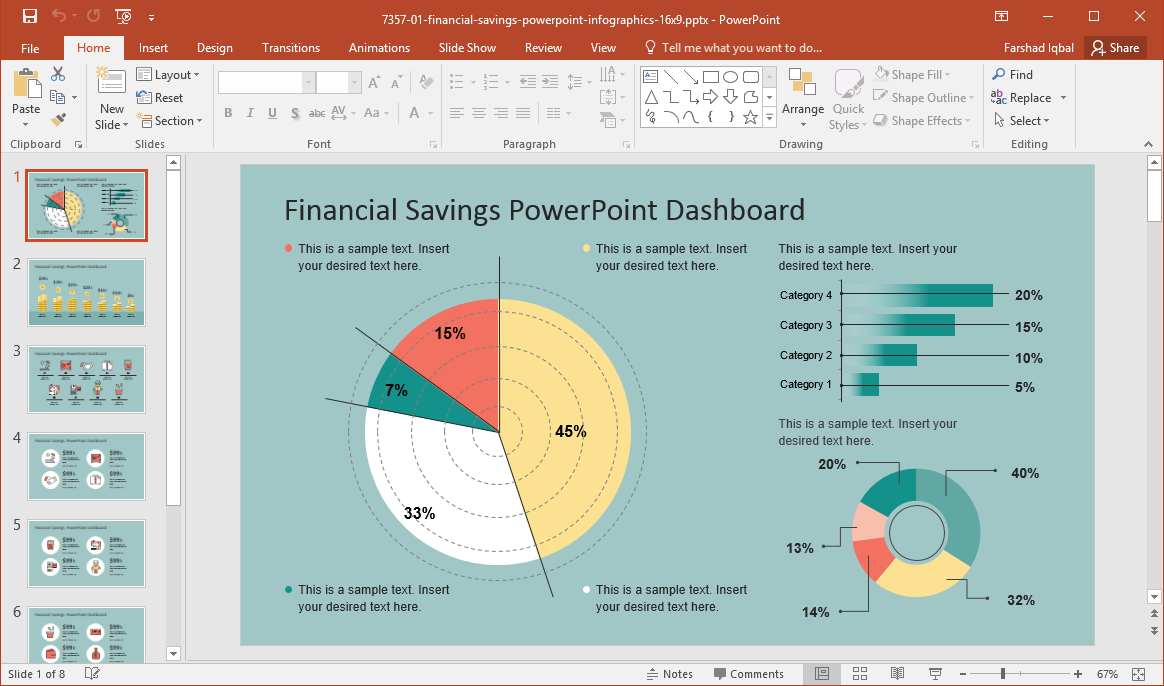
This dashboard presentation template provides not only chart slides in a dashboard layout but also financial icons and infographic layouts to help present complex financial information before an audience that might not have a firm grasp on hardcore financial terminologies and concepts.
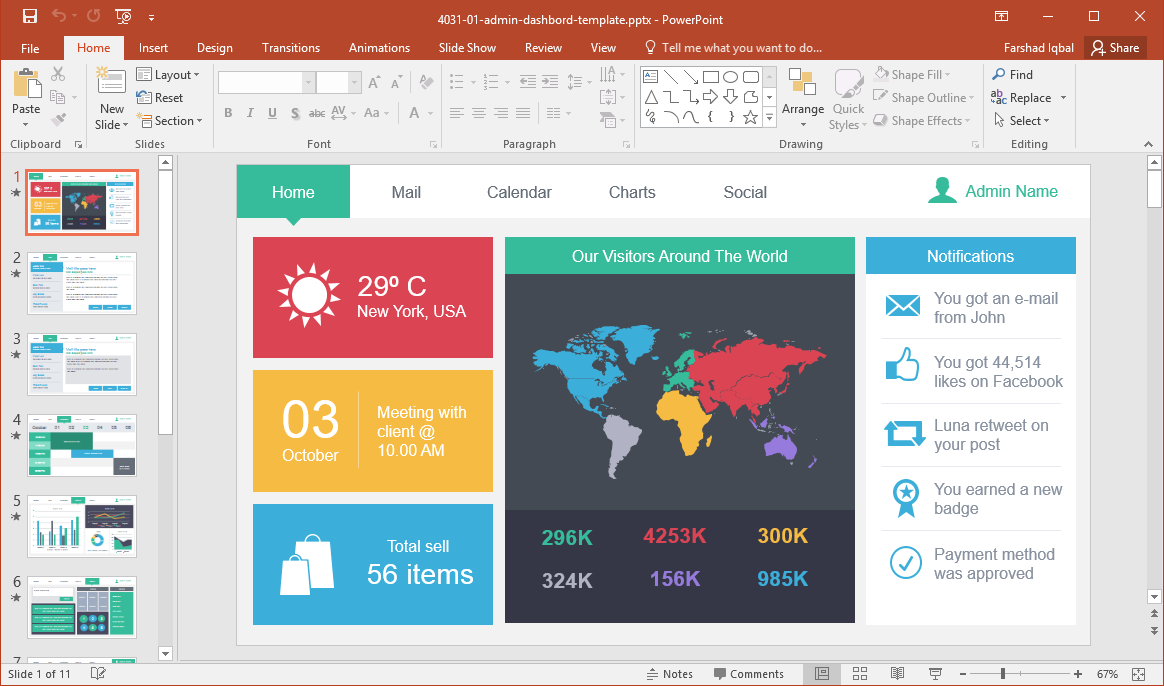
10. Admin Dashboard PowerPoint Template
Designed like a mobile app interface, this is a unique dashboard template for PowerPoint & Google Slides, which can be used for presenting all kinds of information within valuable tabs. You can use the tabbed interface to replace the sample content and add your own to present a diverse set of related information in a stylish, modern layout.
The dashboard templates for PowerPoint mentioned above can help you highlight significant bits of your charts, data, analytics, trends, and related information in small segments to help you make your presentations more organized and short. This can help you reach out to your audience more effectively to ensure that you can cling to their attention while presenting information that can usually be dull and boring.
You can access more than 50,000 professionally designed PowerPoint templates like the ones above from SlideModel.
Get access to more than 20,000 PowerPoint templates available on SlideModel.com
Go to SlideModel.com