Awesome 3D & Animated Charts for Business Presentations
Last updated on August 23rd, 2024
If you need to prepare stunning presentations using PowerPoint then you can get a huge collection of animated charts and 3D charts from PresenterMedia gallery. PresenterMedia is a subscription based service where you can get unlimited downloads for a monthly or annual subscription.
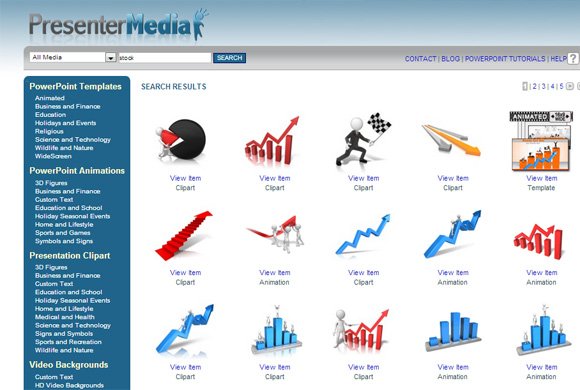
Using the cliparts and animated business chart templates for PowerPoint you can make attractive slides with unique styles to impress your target audience. Here we will see some nice animated stock charts that you can download for presentations on stock market analysis, business presentations, investments, as well as other presentation needs.

Go to PresenterMedia charts download to learn more about these graphics.
3D Animated Bar Chart for PowerPoint Success

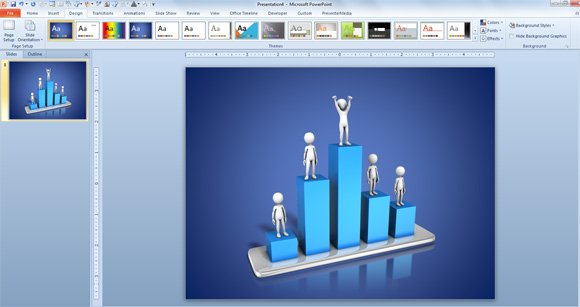
You can get some nice concept charts for PowerPoint presentations for example this animation of a group of unique five stick figures or 3D screen beans being raised up on bar graphs with one clear stand out. This is great for startups and venture projects where you need to identify a growth trend or represent a successful business.
You can also use this bar chart for finance PowerPoint presentations or winning stock as well as representing other situations like move up or competition in a competitive market. You can also use this chart design with animation to represent a market growth stand out of the crowd. For career planning you can use this to choose the right candidate for a job.
Learn more about this chart on PresenterMedia Figure Graph Top Growth.
3D Pie Chart
The 3D Pie chart in PowerPoint has an image of a stick figure carrying a part of the pie chart. You can use this nice 3D chart for PowerPoint presentations to represent a profit or raise, as well as increasing the pie or business profit growth. Also use this nice 3D graphic for PowerPoint to make a sense of money and data business or make some nice reports for business presentations related to success, loss, profit or raise presentations.

Learn more on PresenterMedia – Fit the piece
Additionally you can get other charts and templates including an image of an arrow financial climbing upward with blue line or an image of an arrow moving up the graph showing an increase in profits. There are other some nice metaphor and concept slides like an image of an arrow with stairs going up.
